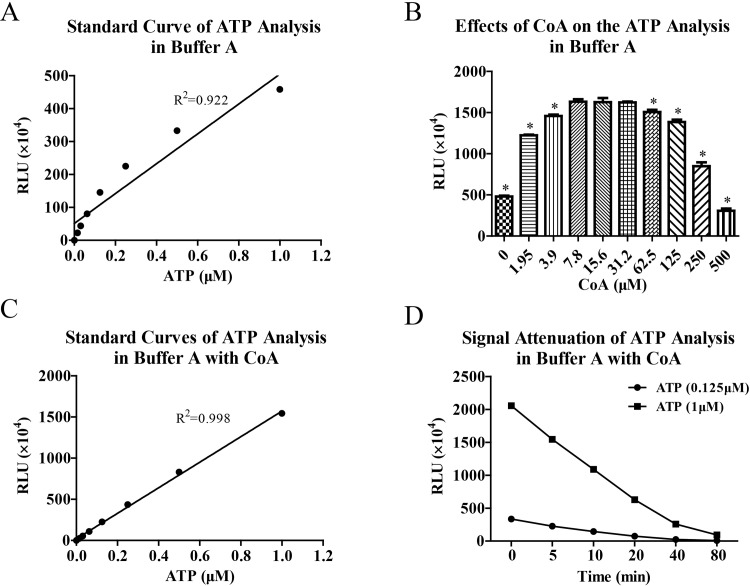
Fig 1.
CoA improved linear range of bioluminescence analysis of ATP in buffer A. Bioluminescence analysis of ATP was performed in buffer A and standard curve was made (A). The effects of CoA on the signal intensity of ATP analysis were evaluated (B). Then standard curve analysis of ATP (C) was made again in the presence of CoA at optimized concentration (15 μM) and signal attenuation of ATP analysis (D) was also estimated by determining relative light unit (RLU) at different time points. Data are representative of three independent experiments. * P < 0.05 vs CoA (15.6 μM).

