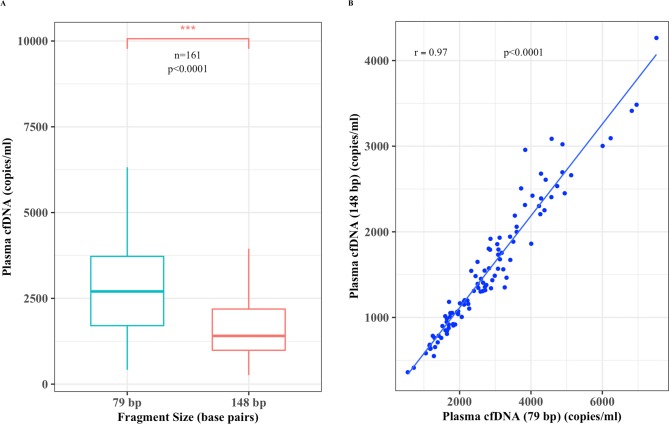
Fig 5. Plasma cfDNA is highly degraded.
(A) Box blot displaying sample plasma cfDNA copies measured by real-time PCR (copies/ml) median; vertical bar, 2701 and 1406) (n = 161) for both 79 bp and 148 bp fragments, respectively and (B) a scatter plot showing a positive linear correlation (r = 0.97, 95%CI = 0.95–0.98, p < 2.2e-16) between the copy numbers of both fragments.

