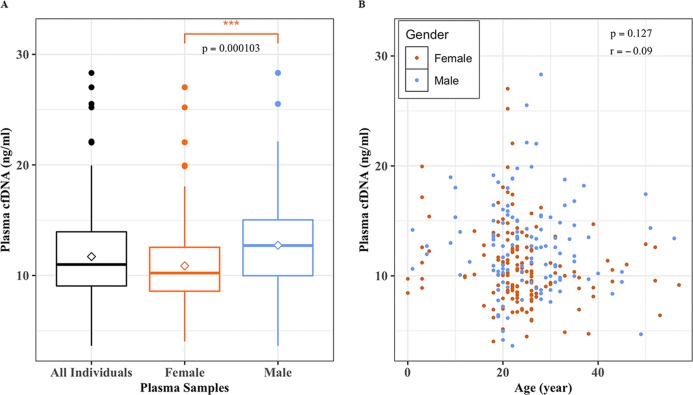
Fig 7. While gender influences cfDNA levels, the age of the individuals has no effect.
(A) A box plots showing mean (diamond shape) and median (vertical bar) plasma cfDNA levels measured by Qubit fluorometer (ng/ml) for all samples (n = 275), female (n = 151; mean = 10.9 ng/ml), and male (n = 124, mean = 12.7 ng/ml). Two sample t-test shows that there is a highly significant difference between female and male subjects (p = 0.0001) in cell-free DNA levels (ng/ml); (B) A scatter plot showing no association between age and plasma cfDNA levels (ng/ml).

