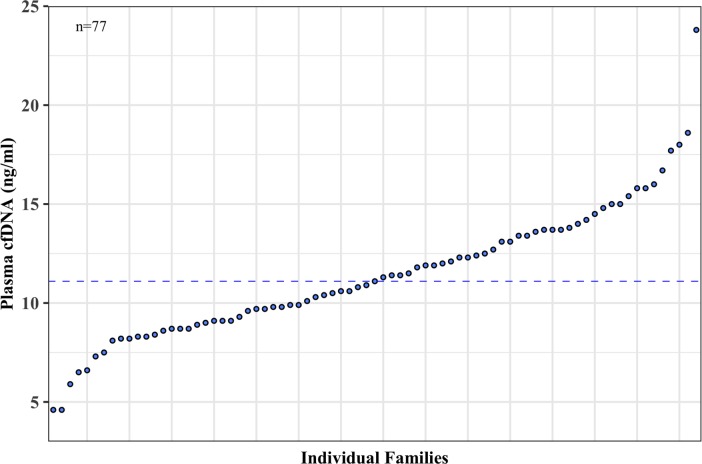
Fig 8. Each family has its own unique cfDNA level.
The mean plasma cell-free (cfDNA) concentration (ng/ml) measured by Qubit fluorometer for individual families (n = 77) is shown in a scatter plot where each dot represents the mean cfDNA value for a single family. The median plasma cfDNA level (11.1 ng/ml) is shown by a dotted line that separates the families into two main groups; families with mean cfDNA levels below and above 11.1 ng/ml.

