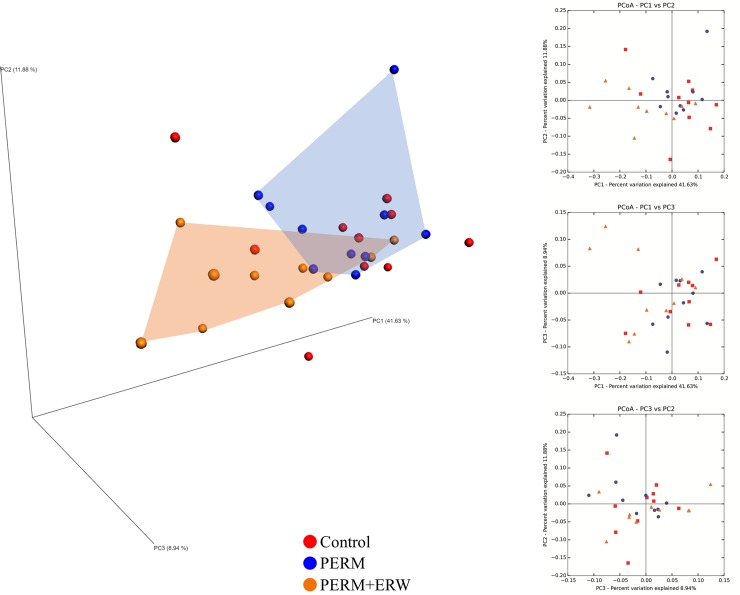
Fig 4. Comparison of variation in fecal microbiota of 2-month-old rats treated in early life with vehicle (Control), permethrin (PERM) or permethrin+electrolyzed reduced water (PERM+ERW).
Principal coordinate plot of weighted UniFrac distances between fecal samples. Each dot represents a sample: red, Control; blu, PERM; orange, PERM+ERW.

