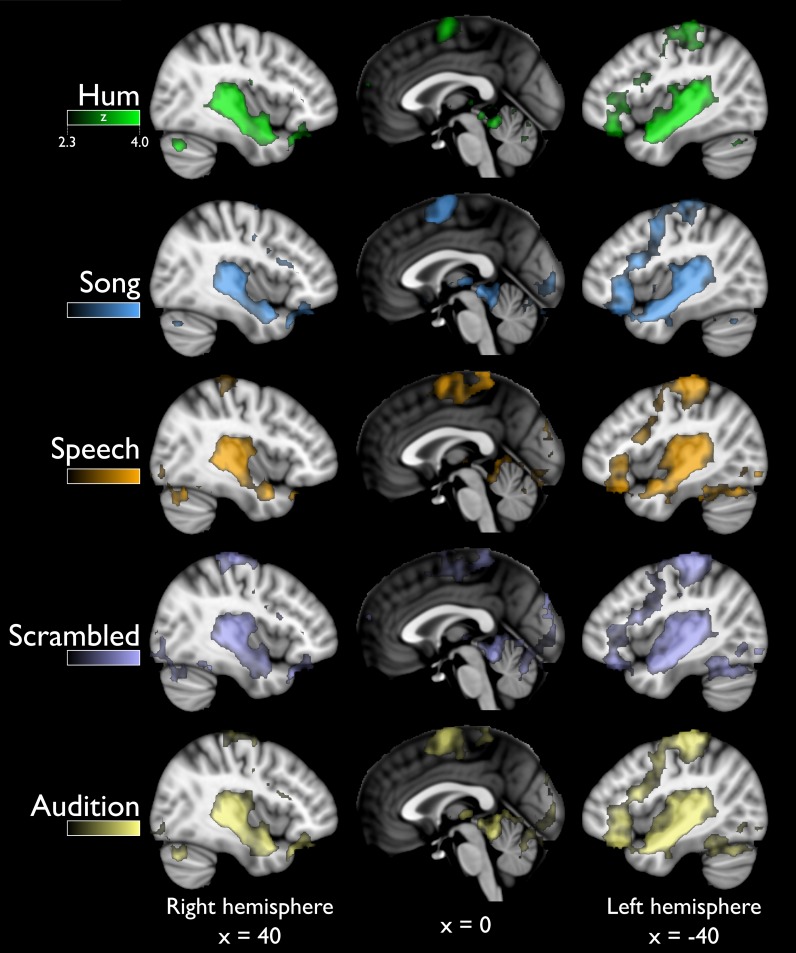
Fig 1. Global activity (above baseline) for all stimuli.
Sagittal views showing distributed activation in response to all sound categories, greater than to scanner noise. The last row (Audition) includes all the previous categories. R = right, L = left. Statistical maps are overlaid on the MNI-152 atlas (coordinates shown in mm). For all categories color scale corresponds to z values in the range (2.3–4.0), as in top panel.

