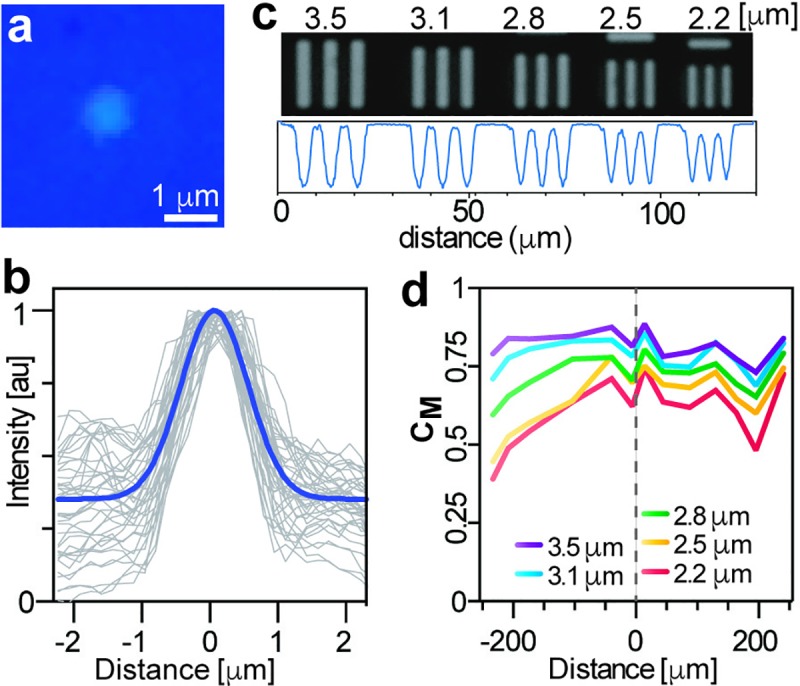
Fig 3. Tests to determine the resolution of the microscope.

(a) Representative image of a 1 μm fluorescent bead. (b) Point spread functions of 40 1-μm beads with the blue line representing the average. (c) Bright-field images of the last 5 elements of group 7 on a 1951 USAF resolution target. Indicated on top is the thickness of each line. Below each image is the line profile as measured at halfway through all the lines. (d) Michelson contrast test using the same USAF target as measured across the width of the image. Gray dashed line represents the center of the image.
