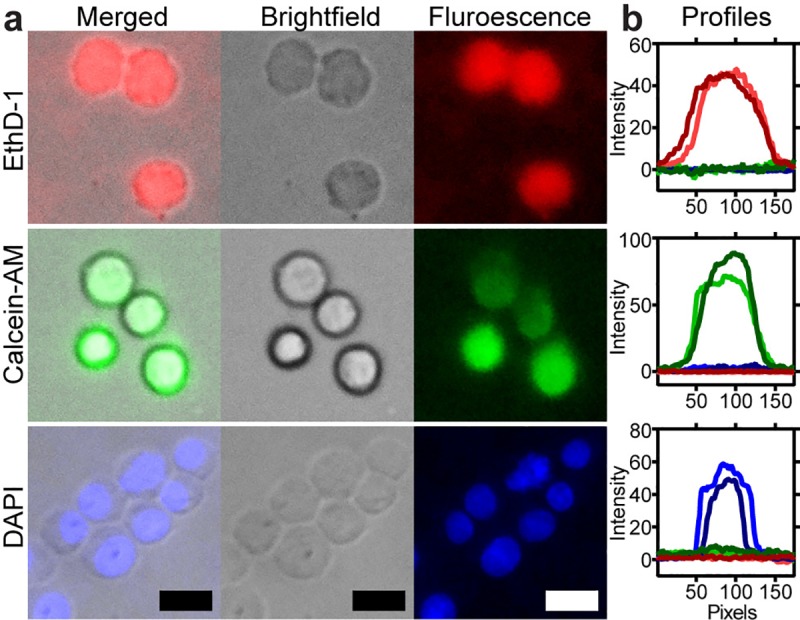
Fig 5. Fluorescence and bright-field micrographs of cells captured with our microscope.

(a) Bright-field and fluorescence micrographs of THP-1 monocytes stained with three different fluorescent dyes. (b) Graphs show the fluorescence intensity profile across two cells in all channels; color represents the fluorescence contribution from each channel. From top to bottom, red, green, and blue fluorescence channel. Scale bar = 15 μm.
