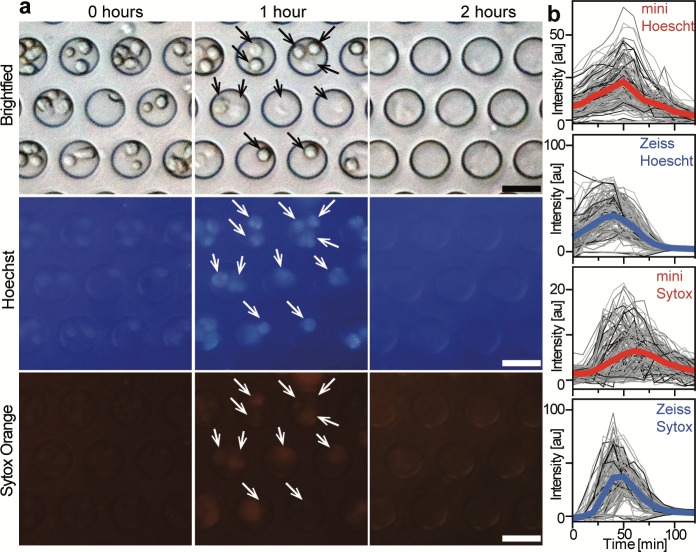
Fig 6. Single cell assays in microwells.
(a) Representative images of the neutrophil assay at different time points acquired with our microscope using plastic filters. Arrows point to single cells trapped in the microwells. Scale bar: 20 μm. (b) Traces of fluorescence intensities from single wells acquired with the miniature microscope (red) and a Zeiss microscope (blue). Thick lines represent the average of ~170 microwells.

