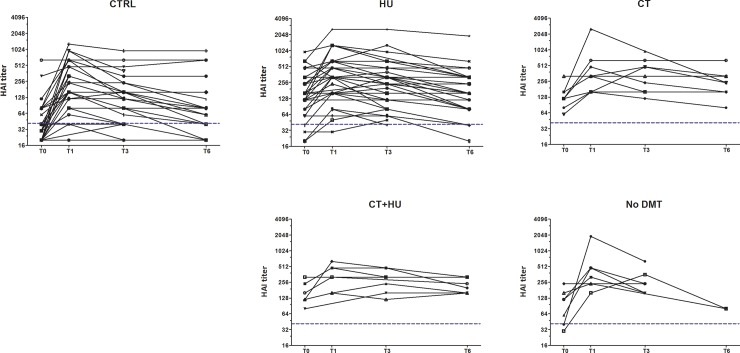
Fig 1. Kinetics of influenza HAI titers.
Evolution of HAI titers measured at 0 (T0), 1 (T1), 3 (T3) and 6 (T6) months after vaccination for each subject. (A) Control group (B) SCD patients divided by treatment group. HU, hydroxyurea; CT, chronic transfusion; CT+HU both chronic transfusion and hydroxyurea; No DMT, No Disease modifying therapy. The dotted lines represent protective titer (1:40).

