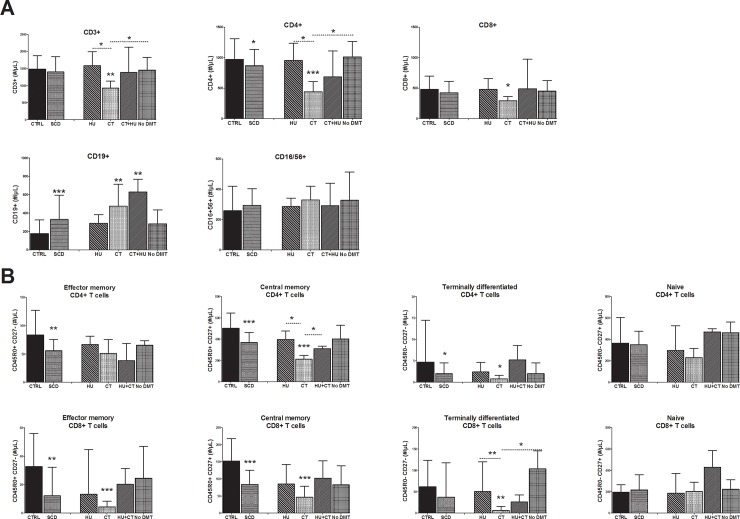
Fig 2. Comparison of lymphocyte cell count in SCD patient treatment groups versus healthy controls.
(A) Total CD3+, CD4+, CD8+, CD19+, CD16/56+ cell counts. (B) CD4+ T cell subpopulations and CD8+ T cell subpopulations cell counts. Comparison between SCD combined groups and healthy control groups were assessed by two tailed nonparametric Mann-Whitney test. Comparison between SCD subgroups according to their treatment and the healthy control group were assessed by the nonparametric Kruskal-Wallis analysis of variance, followed by a Dunn’s multiple comparison test. P-value above bar represent comparison to the healthy control group. Other significant associations are shown. Results of lymphocyte populations are represented as median ± interquartile range (IQR). Results are represented for individuals ≥ 16 years. HU, Hydroxyurea; CT, Chronic transfusion; No DMT, No Disease modifying therapy. *p<0.05; **p<0.01; ***p<0.005.

