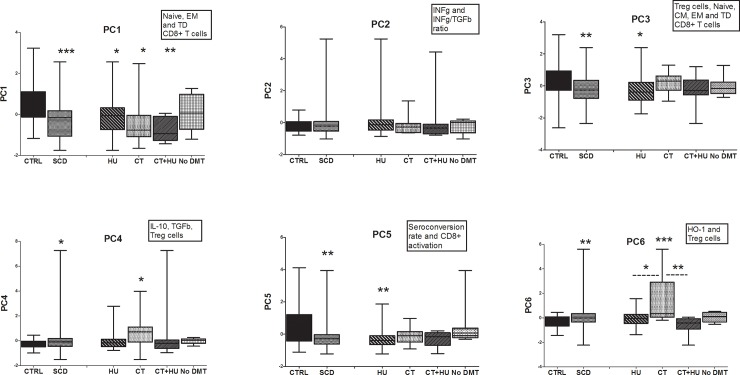
Fig 5. Principal component analysis.
Box plots of PC1 to PC6 for SCD treatment groups compared to healthy controls. Comparison between groups was assessed by Kruskal-Wallis analysis of variance, followed by a Dunn’s multiple. The nonparametric Mann-Whitney U test was used for the comparison of SCD patients and healthy controls.

