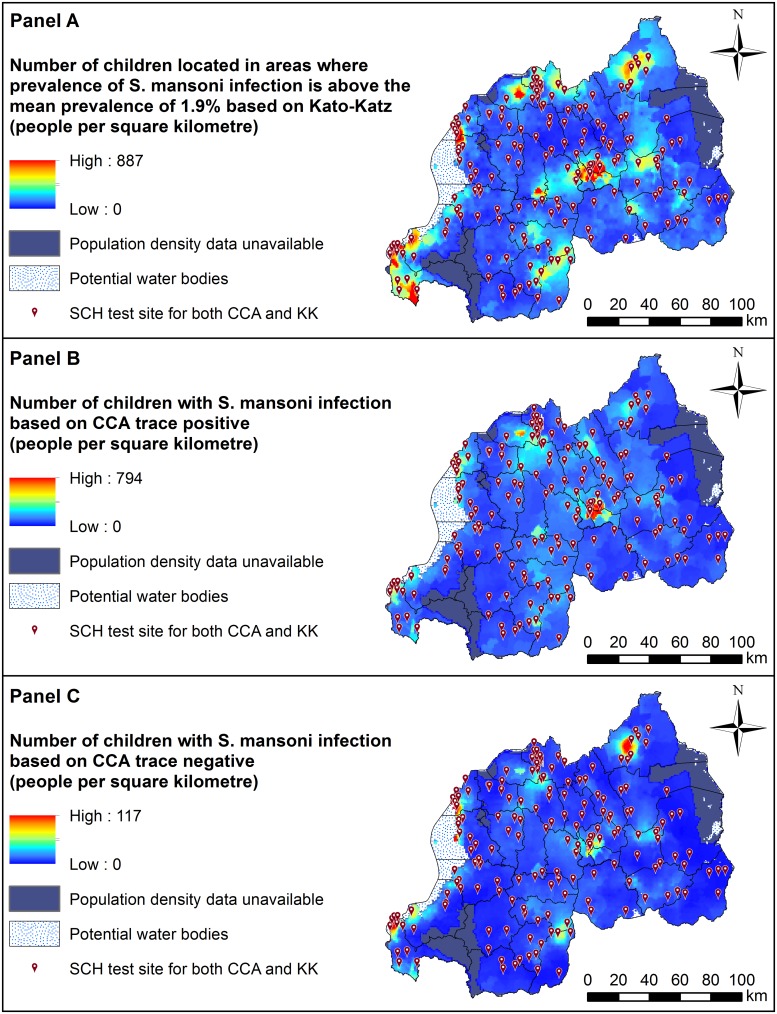
Fig 3. Distributions of the number of Rwandan boys aged 5–9 years (per square kilometre) estimated to be infected with Schistosoma mansoni based on results from three different diagnostic methods: Kato-Katz (Panel A), CCA with trace as positive (Panel B) and CCA with trace as negative (Panel C).
Estimates were generated using geostatistical predictions applied to a map of Rwanda’s 2018 population. This raster was generated by multiplying National Institute of Statistics Rwanda, Fourth Population and Housing Census 2012 data [51, 52] by the reported United Nations Development Programme (UNDP) average annual rate of population change (i.e. 2.53%), which was then multiplied by the proportion of 5–9 year olds. Refer to S3 Fig in Supporting Information for names of geographical districts. This figure was produced in ArcMap 10.4 (ESRI, Redlands, CA) using a shapefile representing Rwanda’s current administrative units (obtained from the geographic data warehouse DIVA GIS (www.diva-gis.org/Data)). CCA; Circulating Cathodic Antigen. SCH; Schistosoma prevalence mapping unit.

