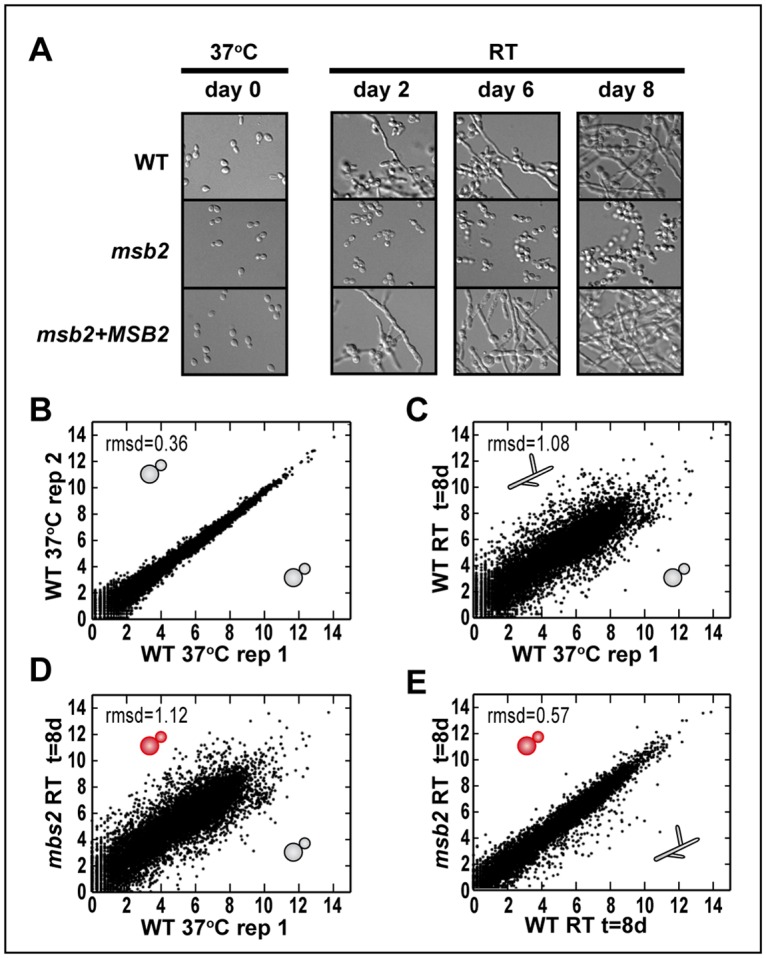
Fig 2. The majority of the temperature-dependent changes in gene expression is independent of Msb2.

(A) Experimental setup for RNAseq time course. Cells shown were grown at 37 °C with 5% CO2 in HMM media with GlcNAc as the carbon source. Once shifted to RT, cells were collected at day 2, 6, and 8 post temperature shift. Images were taken at each time point to compare cell morphology of WT, msb2, and complemented (msb2 + MSB2) strains. (B–E) Scatter plots of relative transcript abundances as log2(cpm) (S3 Data). (B) WT 37 °C replicate 1 (day 0) versus replicate 2 (day 0). (C) WT 37 °C (day 0) versus WT RT (day 8). (D) WT 37 °C (day 0) versus msb2 RT (day 8). (E) WT RT (day 8) versus msb2 RT (day 8). The morphology of each sample is depicted with a cartoon schematic of yeast or hyphae. cpm, counts per million; GlcNAc, N-Acetylglucosamine; HMM, Histoplasma Macrophage Medium; Msb2, Histoplasma ortholog of S. cerevisiae Msb2 (multicopy suppressor of budding 2); rmsd, root mean squared deviation; RNAseq, RNA sequencing; RT, room temperature; WT, wild type.
