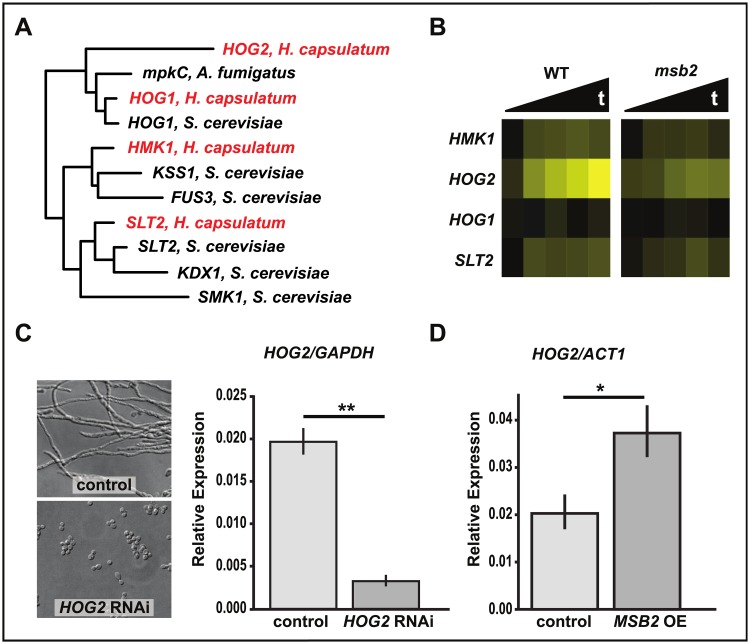
Fig 4. HOG2 is a MAP kinase involved in filamentation in H. capsulatum.
(A) FastTree maximum likelihood phylogeny of the 4 MAP kinases of H. capsulatum (shown in red) and their relation to other fungal MAP kinases based on Pkinase domain alignment. (B) Heat map of HMK2, HOG2, HOG1, and SLT2 data extracted from the RNAseq data set (S3 Data). Values are log2 ratios from single GlcNAc cultures of WT or msb2 at multiple time points after shift to RT, relative to a WT 37 °C sample. (C–D) qRT-PCR data (S9 Data) of HOG2 transcript levels. (C) HOG2 transcript levels in HOG2 RNAi strain (**P < 0.01). Cell morphology of control and HOG2 knockdown strains shown after 8 days at RT. (D) HOG2 transcript levels in MSB2 OE strain grown for 10 days at 37 °C (*P < 0.05). GlcNAc, N-Acetylglucosamine; MAP, mitogen-activated protein; OE, overexpression; qRT-PCR, quantitative Reverse Transcriptase Polymerase Chain Reaction; RNAi, RNA interference; RNAseq, RNA sequencing; RT, room temperature; WT, wild type.

