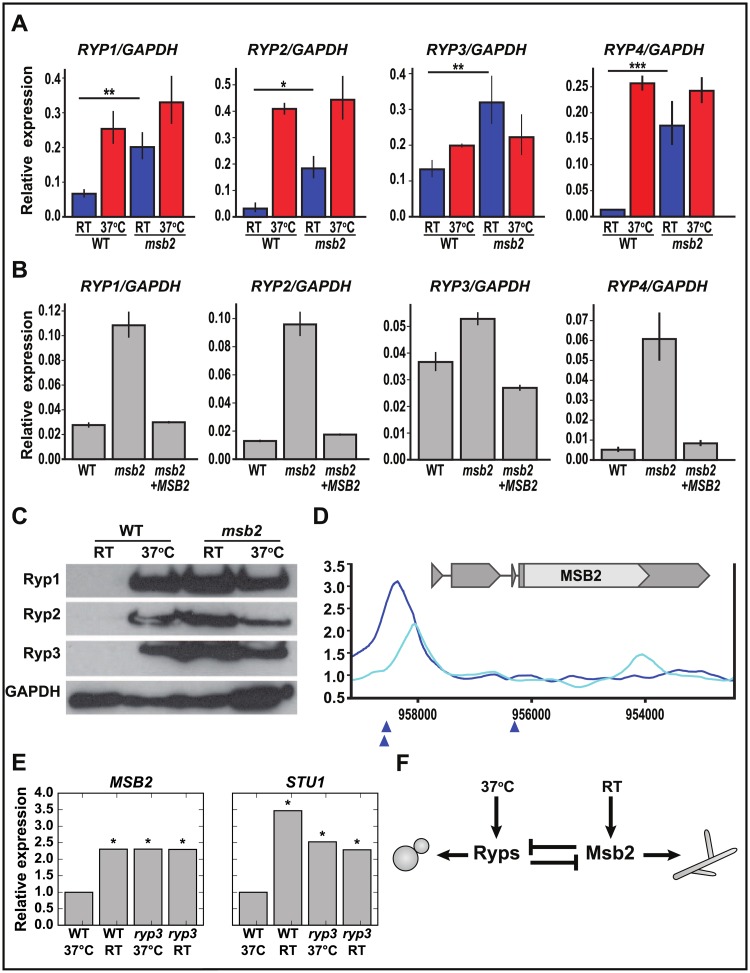
Fig 7. The Ryp and Msb2 programs antagonize each other in a temperature-dependent manner.
(A–B) qRT-PCR analysis (S9 Data) of RYP1-4 transcript levels (A) in WT strain compared with msb2 after 2 weeks at RT: RYP1 (**P < 0.01); RYP2 (*P < 0.05); RYP3 (**P < 0.01); RYP4 (***P < 0.001) and (B) in WT strain compared with MSB2 complemented strain after 2 weeks at RT. (C) Western blots performed on protein extracted from cells grown either at 37 °C or grown at RT for 2 weeks. GAPDH is a loading control. (D) Location of Ryp3 binding site upstream of MSB2 transcript. Smoothed Ryp3 ChIP/input ratio ([2], GEO accession number GSE47341) is plotted for WT (dark blue) and ryp3 control (light blue). Blue triangles indicate locations of Ryp2/Ryp3 associated Motif B [2]. (E) Microarray data [2] showing MSB2 and STU1 transcript levels in WT at RT and ryp3 at 37 °C, normalized to the WT 37 °C level. *p < 0.05 by BAGEL that the indicated condition does not have expression greater than WT 37 °C. (F) Model showing the temperature-dependent relationship between the Ryps and Msb2. BAGEL, Bayesian Analysis of Gene Expression Levels; ChIP, chromatin immunoprecipitation; GAPDH,glyceraldehyde-3-phosphate dehydrogenase; GEO, Gene Expression Omnibus; Msb2, Histoplasma ortholog of S. cerevisiae Msb2 (multicopy supressor of budding 2); qRT-PCR, quantitative Reverse Transcriptase Polymerase Chain Reaction; RT, room temperature; Ryp, required for yeast-phase growth; WT, wild type.

