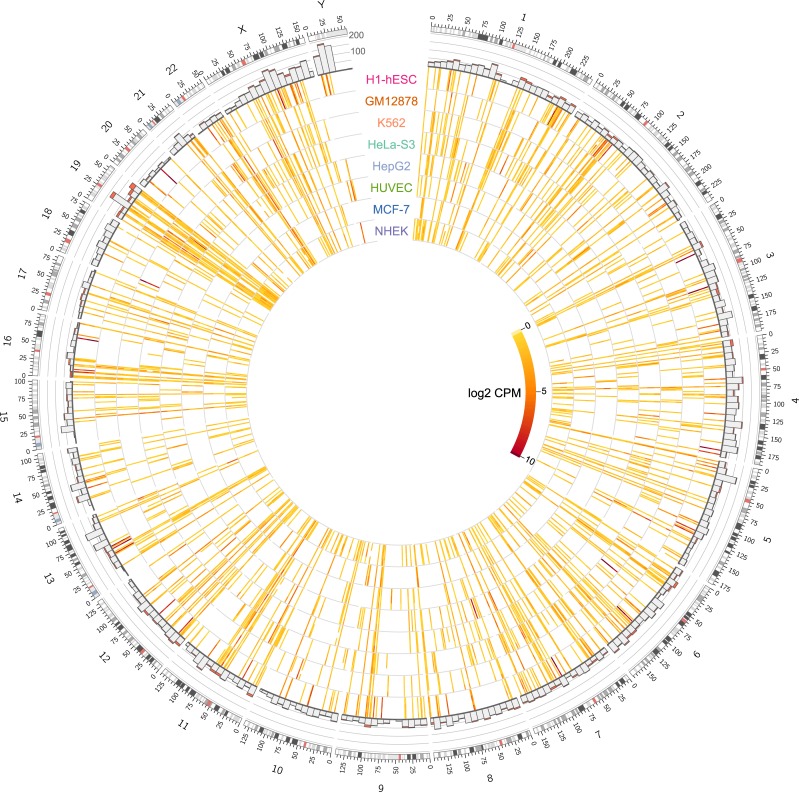
Fig 2. Genome-wide maps of locus-specific HERV expression for 8 ENCODE tier 1 and 2 cell types.
The outer track is a bar chart showing the number of HERV loci in 10 Mbp windows, ranging from 0 to 200, with the red part of the bar representing the number of loci that are expressed in one or more cell types. The 8 inner rings show the expression levels (log2 counts per million (CPM)) of 1365 HERV loci that were expressed in at least one of the cell types examined. Moving from the outer ring to the inner ring are replicates for each of the 8 cell types with duplicates: H1-hESC, GM12878, K562, HeLa-S3, HepG2, HUVEC, MCF-7, and NHEK.

