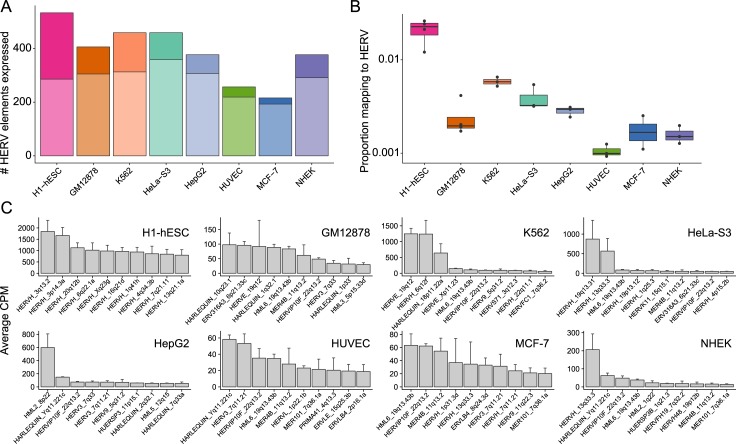
Fig 3. Overall HERV expression patterns.
(A) Number of HERV elements that are expressed for each cell type; expressed loci have CPM > 0.5 in the majority of replicates. The darker section of the bar corresponds to expressed loci that are unique to cell type, while the lighter part is expressed in other cell types. (B) The proportion of mapped RNA-seq fragments that are generated from HERV transcripts in each of eight replicated cell types. Each point is one replicate; boxplot shows the median and first and third quartiles. (C) Top 10 most highly expressed loci for each cell type. Height of the bar is average CPM of all replicates with error bars representing the standard error calculated from replicates CPM values.

