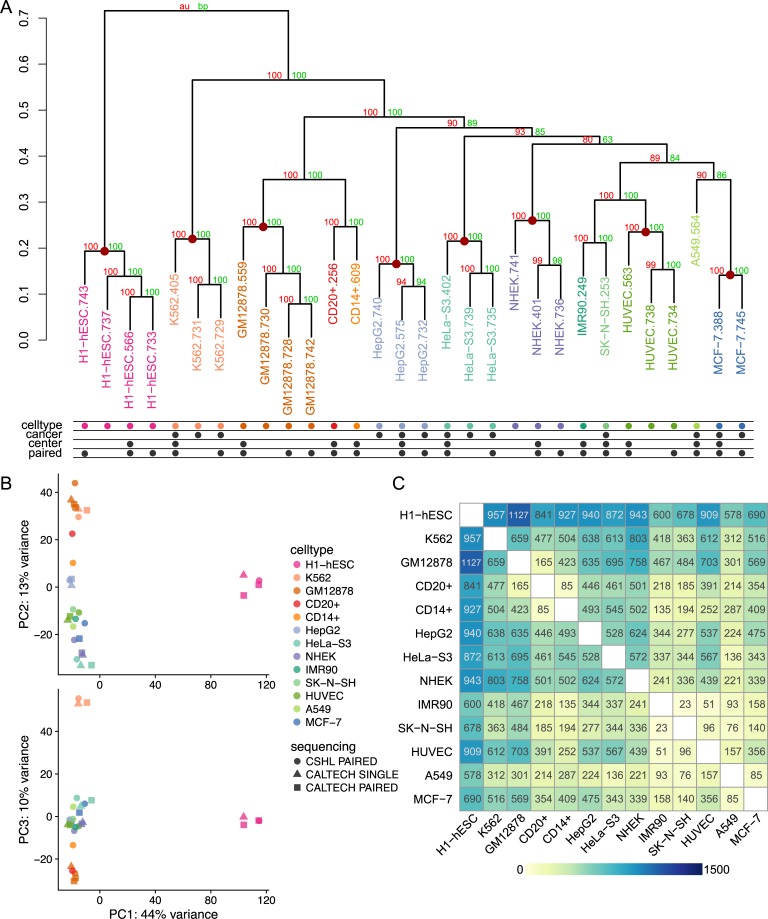
Fig 5. Cell type characterization based on HERV expression profiles using unsupervised learning and linear models.
Unsupervised learning and linear modeling were used to identify patterns in HERV expression profiles generated by Telescope for 30 polyA RNA-seq datasets from 13 cell types. (A) Similarities among normalized expression profiles were explored using hierarchical cluster analysis. Supporting p-values were based on 1000 multiscale bootstrap replicates and calculated using Approximately Unbiased (AU, red) and Bootstrap probability (BP, green) approaches. Red dots are placed on nodes that exclusively cluster together all replicates for a cell type. (B) Principal component analysis (PCA) of normalized expression profiles. The first component accounts for 44% of the variance in the data, and is plotted against component 2 and 3, which account for 13% and 10% of the variance, respectively. (C) Heatmap of the number of HERV elements found to be significantly differentially expressed (DE) among each pair of cell types. Significance was determined using cutoffs for the false discovery rate (FDR < 0.1) and log2 fold change (abs(LFC) > 1.0). Yellow indicates low numbers of differentially expressed elements, while blue indicates high numbers.

