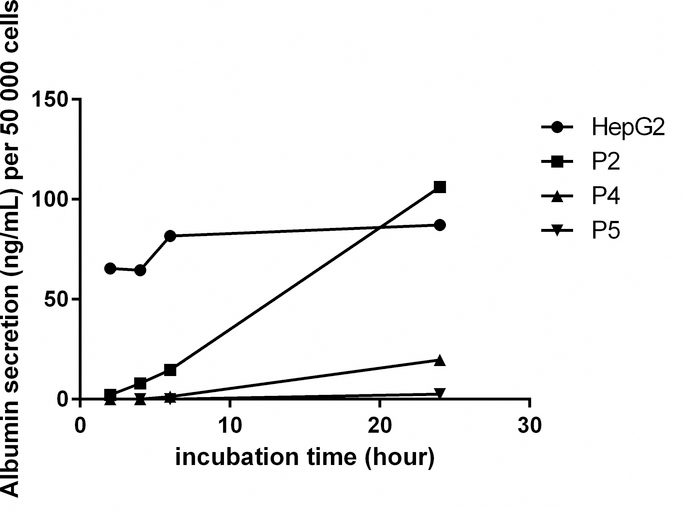
Figure 6.
Albumin secretion of PHH after 2, 4, 6 or 24 hours incubation. Mean values of each standard and sample were obtained from replicate wells. The standard curve was produced by plotting the concentration of standard on the x-axis and the corresponding 450 nm absorbance on the y-axis. The best-fit line was generated by regression analysis using four-parameter logistic curve-fit. The albumin concentration of samples was calculated from the standard curve.

