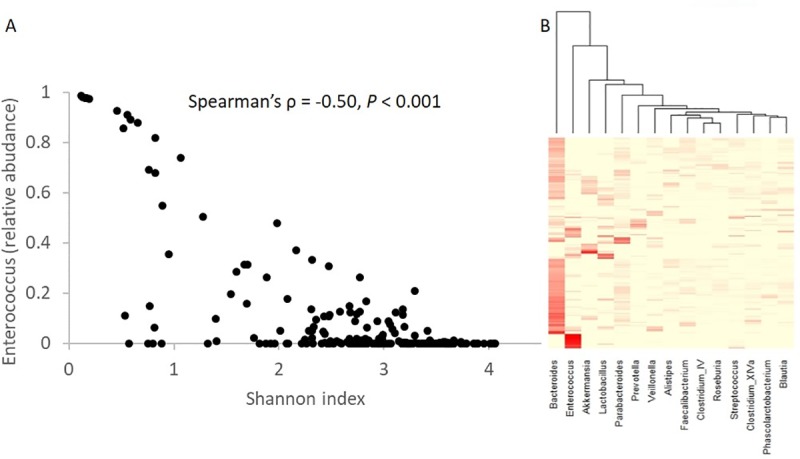
Fig 1. Microbiota diversity and composition.

There is a negative correlation between Shannon diversity and Enterococcus relative abundance. Each point represents a sample. (B) Heatmap of microbiota relative abundances from 16S rRNA amplicon sequencing. Each column shows a genus and each row represents a sample. Only the 15 most abundant genera are shown.
