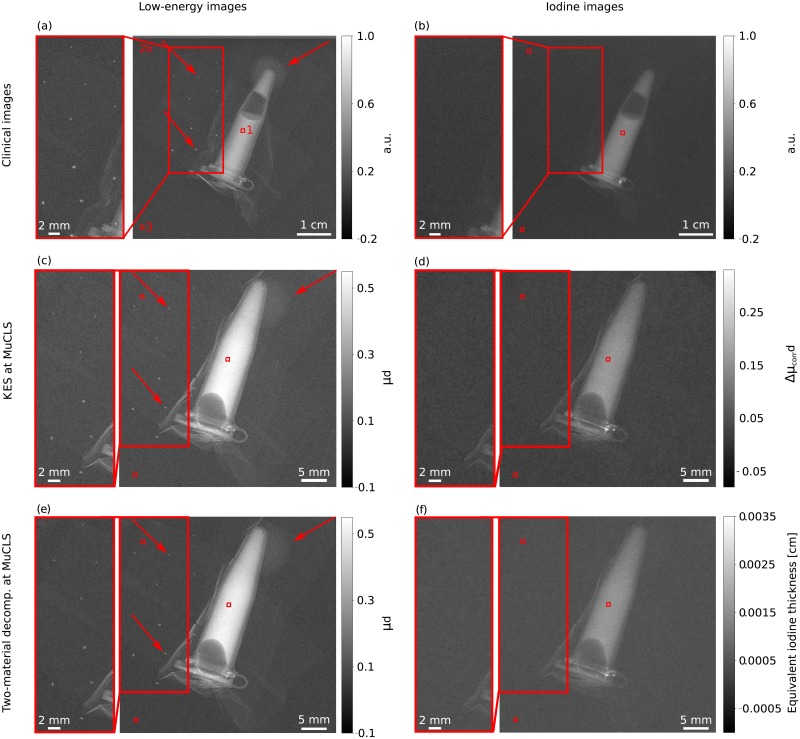
Fig 4.
Overview of the laboratory and clinical results of CESM showing (a) the clinical low-energy image, (b) the clinical iodine image, (c) the low-energy image for KES at the MuCLS, (d) the iodine image processed with KES imaging, (e) the low-energy image of the material-decomposition at the MuCLS and (f) the iodine image processed with a two-material decomposition. Thereby, the zoom-in sections are intended to provide an improved representation of microcalcifications. The low-energy images in (a), (c) and (e) show the iodine tube, the microcalcifications and one tumor mass whereas in (b), (d) and (f) the successful elimination of the microcalcification and the tumor mass is shown and also underlined by the zoom-in sections. The microcalcifications and the tumor mass are indicated by the red arrows in Fig (a), (c) and (e). It should also be noted that as the images depict different quantities, a single common gray-level windowing suitable for all cannot be applied and the windowing is not the same in the presented images. The clinical images are given in arbitrary units and have only been normalized to one. All images were scaled for maximum detail visibility. The red boxes denote the different (ROIs) used for the CNR calculation of the iodine solution (cf. Eq 6).

