Figure 6.
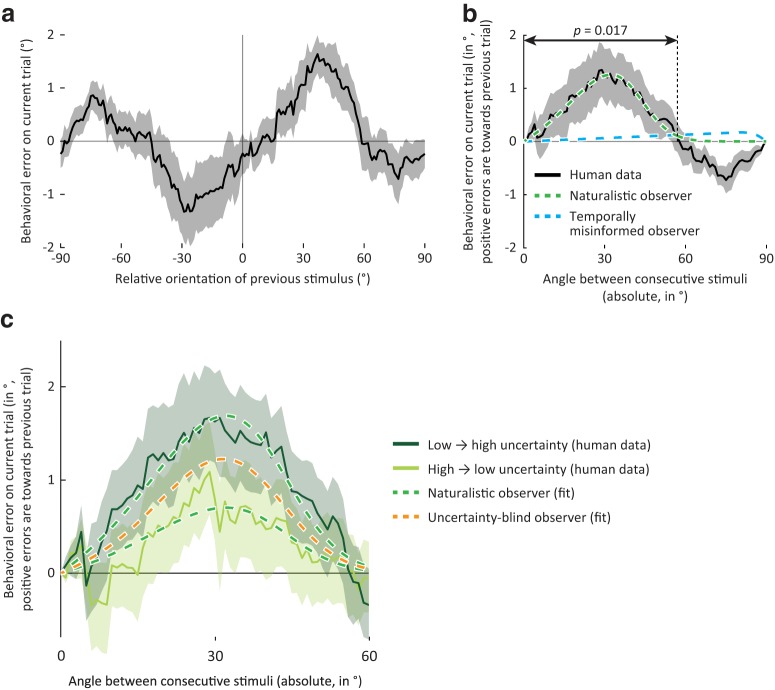
Human behavior matches the predictions of the naturalistic observer model. a, Group-average behavioral errors, smoothed with a moving average filter, as a function of the relative orientation presented on the previous trial. Positive errors and orientation differences are in the clockwise direction. In this and subsequent panels, solid line and shaded region represent the mean ± SEM across observers. b, Same as in a, but with behavioral errors realigned such that positive deviations are in the direction of the orientation presented on the previous trial, and plotted against the absolute, rather than the signed, difference in orientations. Arrows indicate the extent of orientation differences for which a cluster-based analysis revealed a significant bias in the direction of the previous trial (p = 0.017). A small negative serial dependence bias is also apparent for orientation angles > ±60° but did not reach statistical significance (p = 0.079, cluster-based permutation test). Green curve indicates the optimal fit of the naturalistic ideal observer model to the behavioral data. This model explains significant variance in the data (R2 = 0.86, p = 0.02). Blue curve indicates the optimal fit of an alternative observer model ignoring natural temporal statistics. The bias curve generated by this model is very different in shape from that observed in human behavior, and does not capture the human data well (R2 = 0.02, p = 0.41). c, Similar to the naturalistic observer, the serial dependence bias in human behavior is stronger when the sensory representation is more uncertain on the current than previous trial (dark green), compared with when sensory information is less uncertain now than in the recent past (light green; t(17) = 2.96, p = 0.009). Dashed curves indicate the optimal fit of the naturalistic observer (green) and uncertainty-blind observer models (orange). The naturalistic observer model explained significantly more variance than a model ignoring fluctuations in uncertainty (R2 increase from 0.65 to 0.78, p = 0.01), suggesting that, like the naturalistic observer model, human observers integrate current and previous sensory inputs in an uncertainty-weighted manner.

