Figure 6.

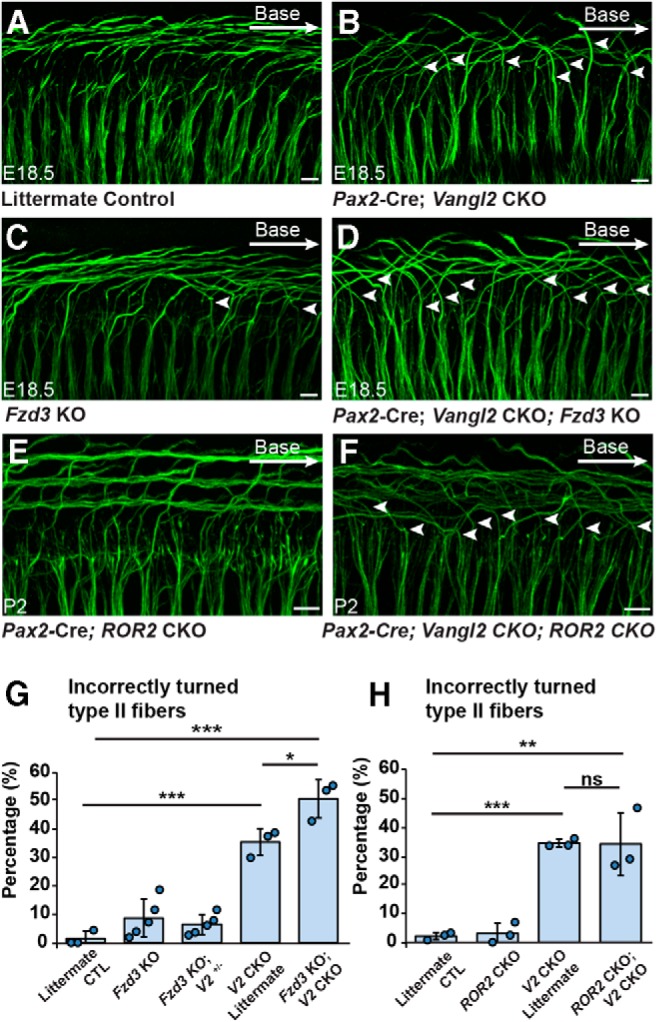
Fzd3, and not ROR2, genetically interacts with Vangl2 in SGN development. A–D, NF200 immunolabeling of Type II SGN peripheral axons in Pax2-Cre;Vangl2 CKOs and littermate controls generated on a Fzd3 KO background. Arrowheads indicate Type II fibers, which have turned incorrectly toward the cochlear apex. E, F, NF200 labeled Type II peripheral axons in Pax2-Cre;ROR2 CKO and Pax2-Cre;ROR2; Vangl2 double CKOs. G, Quantification of the average frequency of turning errors for cochlea of each genotype demonstrates a genetic enhancement with the loss of Vangl2 and Fzd3. H, Similar quantification of turning errors in Pax2-Cre; ROR1; Vangl2 double CKOs did not reveal a genetic interaction between Vangl2 and ROR2. Data are mean ± SD with overlying circles reporting to the frequency of turning errors for individual mice. A single cochlea was analyzed from each animal. For Vangl2-Fzd3 interaction assays, images and quantification are from the basal turn of E18.5 cochlea: Control (n = 3, 159 axons), Fzd3 KO (n = 5, 248 axons), Fzd3 KO, Vangl2+/− (n = 5, 234 axons), Vangl2 CKO (n = 3, 101 axons), Fzd3 KO; Vangl2 CKO (n = 3, 117 axons). For Vangl2-ROR2 interaction assays, images are from the basal turn, and quantification is summed from basal, middle, and apical turns: Control (n = 3, 375 axons), ROR2 CKO (n = 3, 380 axons), Vangl2 CKO (n = 3, 324 axons), ROR2 CKO; Vangl2 CKO (n = 3, 313 axons). *p ≤ 0.05; **p ≤ 0.01; ***p ≤ 0.001; ns (not significant); pairwise comparisons as indicated (Student's t test). All images are from E18.5 cochlea and scalebars are 10 μm.
