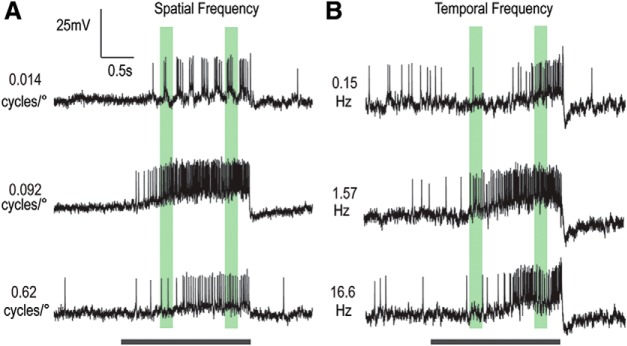
Figure 3.
Responses of an individual LPTC to select spatial and temporal frequencies (contrast ramped drifting gratings). An example LTC shows strong consistency in spatial and temporal tuning over increasing contrast and time. Black bar represents stimulus duration. Green regions represent early and late analysis windows. A, Raw responses to gratings with 3 spatial frequencies (0.014, 0.092, and 0.62 cycles/°) at a temporal frequency of 5 Hz. Responses reveal phase locking at low frequencies and are most robust at the middle spatial frequency. B, Raw responses to 3 temporal frequencies (0.15, 1.57, and 16.6 Hz) at a constant spatial frequency of 0.1 cycles/°. For this example LTC, responses are most robust at the middle temporal frequency, and this preference is sustained throughout the stimulus duration.

