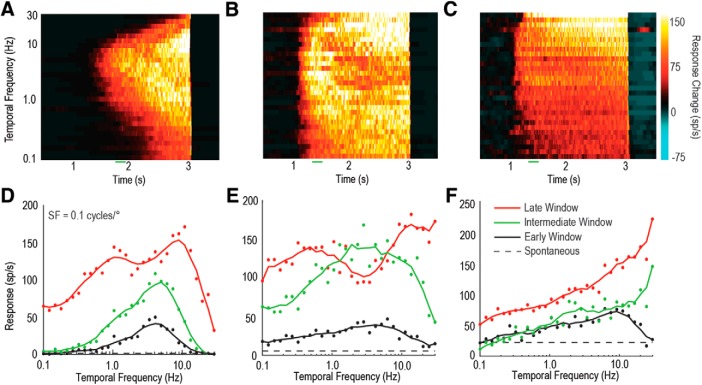
Figure 4.
Individual LTCs show varied patterns of tuning at different temporal frequencies. A–C, 3D color maps of the change in spike rate over time (from spontaneous) when presented with contrast ramps at 30 different temporal frequencies (spatial frequency of 0.1 cycles/°). These examples reveal three LTCs with different tuning properties. D–F, LTC temporal tuning curves are derived by averaging neuronal responses within analysis windows (200 ms) early in the ramp (low contrast, black line), intermediate (300 ms after low contrast, green line), or late (high contrast, red line).

