Figure 6.

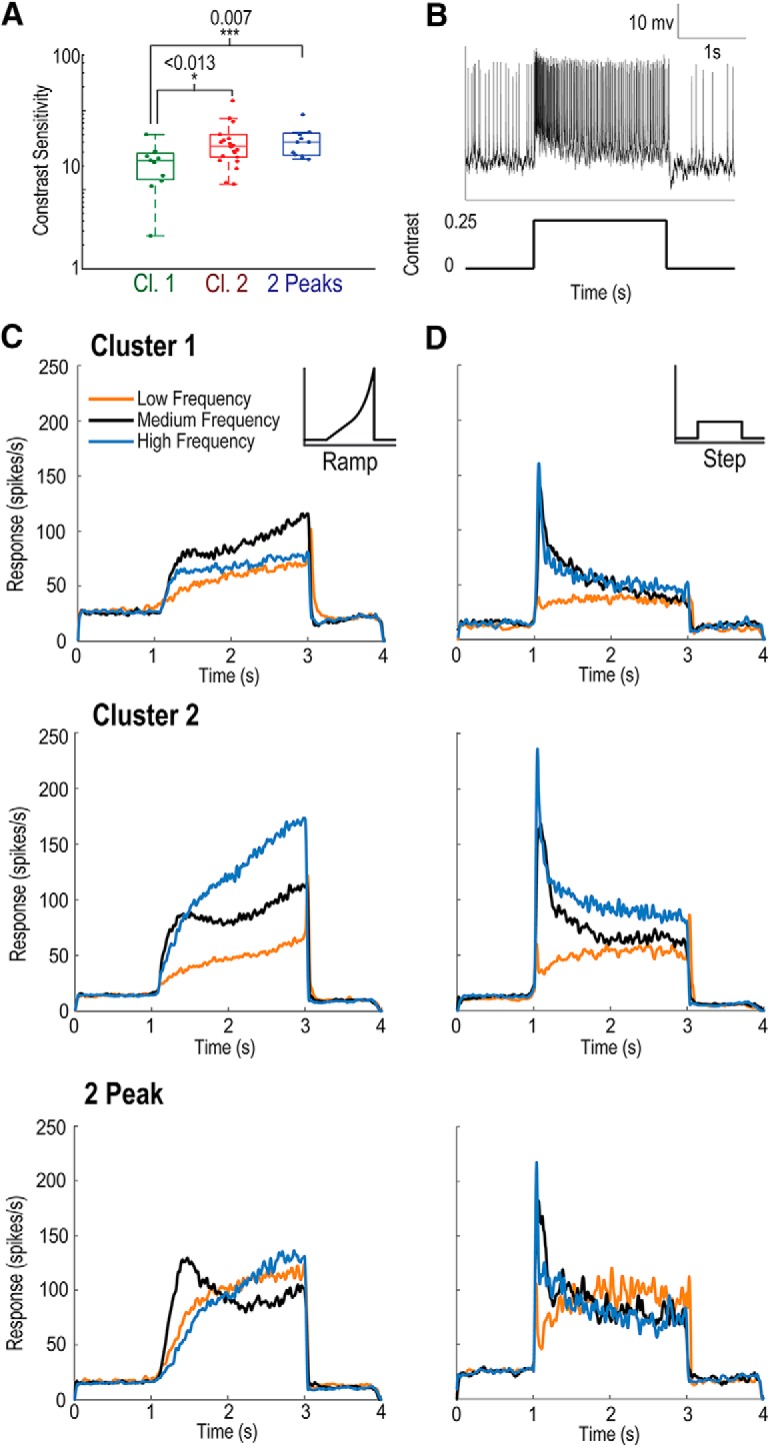
LTCs exhibit temporal adaptation. A, Boxplot distributions of LTC contrast sensitivity (to a drifting grating) derived from the contrast required to evoke a neuronal response (2× the SD of the spontaneous activity). Cluster 1 neurons exhibit significantly lower peak contrast sensitivity than the other two groups (Mann–Whitney U test; Cluster 1, n = 11; Cluster 2, n = 21; 2-Peak, n = 12). B, Individual raw spike trace in response to a contrast step. Neurons are exposed to 2 s of a constant contrast (0.25Michelson) grating after 1 s of a gray screen. C, Mean response over time taken for contrast ramps from the average of three temporal frequency ranges (low, 0.27–0.4 Hz, orange; medium, 3.4–5.1 Hz, black; high, 13.7–20.2 Hz, blue) for each of the three LTC groups (top, Cluster 1; middle, Cluster 2; bottom, 2-Peak). Cluster 1 LTCs exhibit a stronger response to medium frequencies, which temporarily flatten 300 ms after ramp onset, then slowly rise with increased contrast. Cluster 2 LTCs exhibit an early strong response at medium frequencies before significant adaptation and flattening of the response. At high temporal frequencies, no such flattening occurs with responses increasing strongly with contrast. Responses to low frequencies are uniformly low and only rise slowly with time (and contrast). 2-Peak LTCs exhibit a strong early response to medium frequencies before weakening over time, whereas responses to low and high frequencies slowly and steadily increase. D, Same as in C, but in response to contrast steps. All groups show large onset transients, most pronounced at medium and high temporal frequencies. We observe sustained temporal adaptation over the stimulus duration. Cluster 2 neurons maintain stronger responses to high temporal frequencies over the entire time course. 2-Peak neurons quickly reach similar responses from all temporal frequencies, with low temporal frequencies having the strongest response late in stimulus duration.
