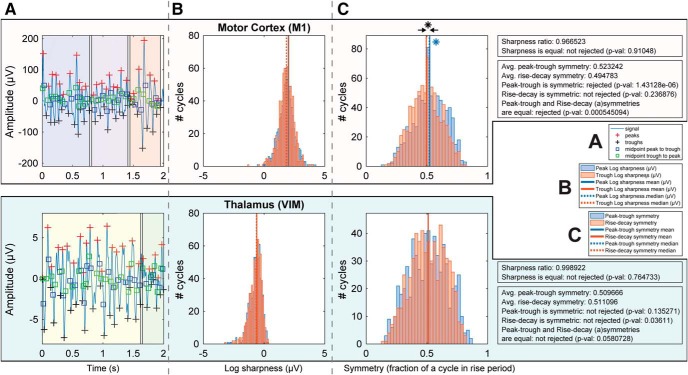
Figure 8.
Single-subject wave shape analysis of alpha-beta oscillations. A, Filtered signal (bandpass filtered 6–40 Hz) parsed to find peaks (red crosses), throughs (blue crosses), and cross points (blue and green squares). The highlighted blocks (blue, violet, red) represent the found bursts based on cycle thresholding (amplitude >0.1 of z-normalized values). Top, Burst/cycle analysis from M1. Bottom, From VIM. B, Sharpness distribution for trough and peak of alpha-beta oscillations. C, Distributions of rise-decay and peak-trough period symmetry of alpha-beta oscillations. Although the peak-trough symmetry median for M1 deviated from 0.5 (by 0.023242), this shift does not affect the presence of PAC, but only the phase at which PAC occurs. *p < 0.01.

