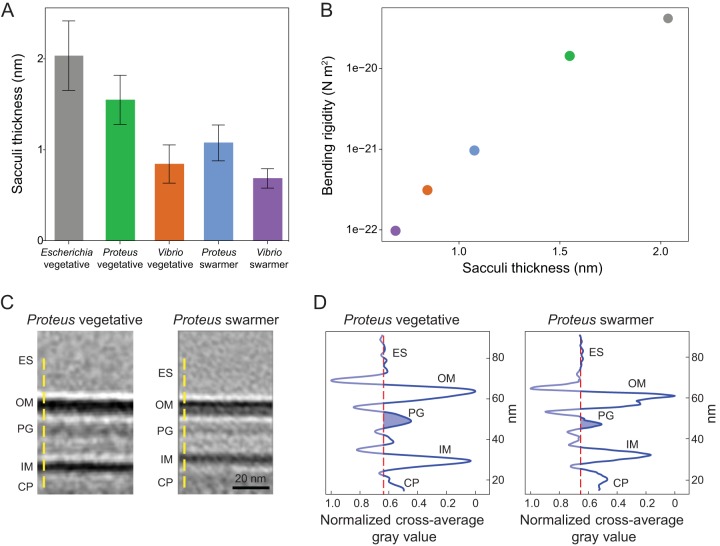
FIG 6.
AFM revealed that the PG layer of P. mirabilis and V. parahaemolyticus swarmer cells is thinner than in vegetative cells, and ECT demonstrated a reduced membrane-to-membrane distance. (A) Sacculi were isolated from cells, dried, and imaged by AFM. The thickness of swarmer cell PG was reduced compared to that seen with vegetative cells. We analyzed >65 vegetative cells of E. coli, P. mirabilis, and V. parahaemolyticus; >65 P. mirabilis swarmer cells; and 7 V. parahaemolyticus swarmer cells. Error bars represent the standard deviations of the means. (B) Bending rigidity and cell wall thickness display an approximately exponential relationship (R2 = 0.9874). (C) Subtomograph-averaged ECT volume images of the P. mirabilis vegetative (left) and swarmer (right) cell wall. Two central slices of subtomogram average volume images with normalized image densities are shown. Yellow dashed lines indicate the orientation used for gray-value measurements. ES, extracellular space; OM, outer membrane; PG, peptidoglycan; IM, inner membrane; CP, cytoplasm. (D) The density profile of subtomogram-averaged ECT volume images reveals reduced membrane-to-membrane distance in swarmer cells. The vertical-axis data represent normalized values corresponding to the shades of gray shown in panel C, with the darkest value equal to 0 and the lightest value equal to 1. The red dashed lines in the left and right panels denote the average value of the extracellular space represented by the shades of gray and serves as a reference for the background; the blue-shaded area indicates the thickness of the putative PG layer.

