. 2019 Oct 1;8:e49062. doi: 10.7554/eLife.49062

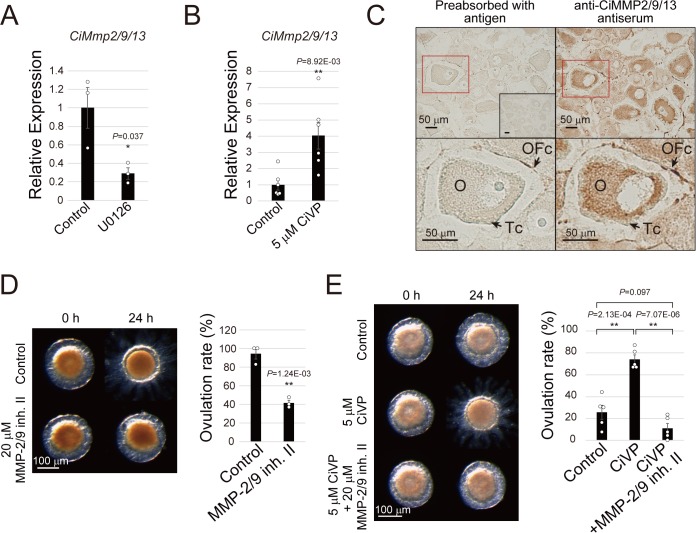
Figure 5. CiVP activates CiMMP2/9/13 via MEK/ERK signaling during ovulation.

(A, B) qRT-PCR indicated that MEK inhibition with 10 μM U0126 in early stage III follicles (A) and 5 μM CiVP stimulation in late stage II follicles (B) for 24 hr results in decrease and increase of CiMmp2/9/13 expression relative to CiUbac1, respectively. Data from three (A, n = 3) and six (B, n = 6) independent experiments were analyzed by Student’s t test and are shown as mean ± SEM with data points (t-value: 3.08; *, p=0.037 in (A) and t-value: −3.24; **, p=8.92E-03 in (B)). (C) Immunohistochemistry using anti-CiMMP2/9/13 antiserum and the ABC detection system confirmed that CiMMP2/9/13 is localized in oocytes (O) and outer follicular cells (OFc), but not in test cells (Tc). Antiserum pre-absorbed with antigen or pre-immune serum (inset) were used as negative controls. Enlarged images of red-boxed areas in the upper panels are shown below. (D) Treatment with 20 μM MMP-2/9 inhibitor II significantly inhibited ovulation of late stage III follicles (t-value: 8.14; **, p=1.24E-03). (E) Significant CiVP-induced ovulation of late stage II follicles (t-value: −6.38; **, p=2.13E-04) was disrupted by MMP-2/9 inhibitor II (t-value: 10.25; **, p=7.07E-06). Data from three (D, n = 3) and five (E, n = 5) independent experiments were analyzed by Student’s t test and are shown as mean ± SEM with data points.

Figure 5—source data 1. Source data for Figure 5A,B,D,E, Figure 5—figure supplements 1 and 3.
Relative expression values of the CiMmp2/9/13 gene to CiUbac1 (RNA-seq and qRT-PCR data, Figure 5A and B). Percentages of ovulated follicles after incubating with CiVP and/or MMP-2/9 inhibitor II (Figure 5D and E). Relative expression values of the CiMmp genes to CiUbac1 (RNA-seq data, Figure 5—figure supplement 1). Raw values of in vitro collagenase activity of recombinant MMP-2/9/13 are also shown (Figure 5—figure supplement 3).
DOI: 10.7554/eLife.49062.025

Figure 5.

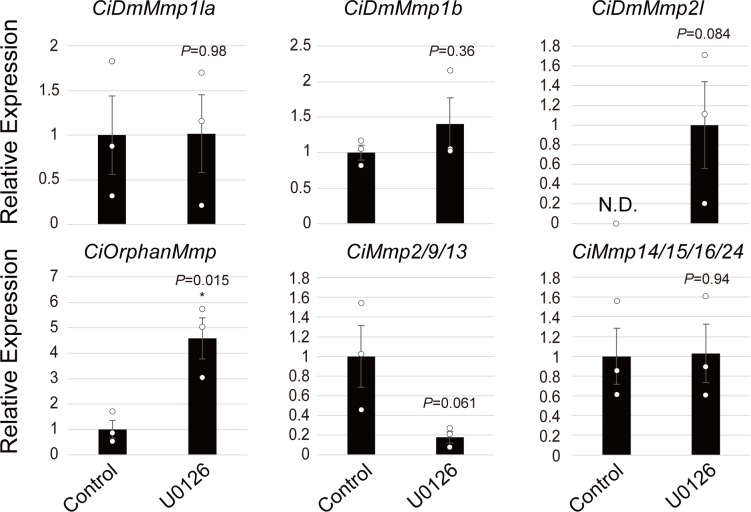
Figure 5—figure supplement 1. Ciona-MMP expressions in MEK-inhibited follicles.

Figure 5—figure supplement 1.

The expression of six MMP genes in Ciona was investigated using RNA-seq data. Data were analyzed by Student’s t test compared with control (t-value: −0.026; p=0.14 for DmMMP1 like a; t-value: −1.03; p=0.36 for DmMMP1 like b; t-value: −2.28; p=0.084 for DmMMP2 like; t-value: −4.05; *, p=0.015 for OrphanMMP; t-value: 2.58; p=0.061 for MMP-2/9/13; t-value: −0.074; p=0.94 for MMP-14/15/16/24) and are shown as mean ± SEM (n = 3). The expression of only CiMmp2/9/13 was downregulated in MEK-inhibited follicles, along with the ovulation rate. N.D., not detected.
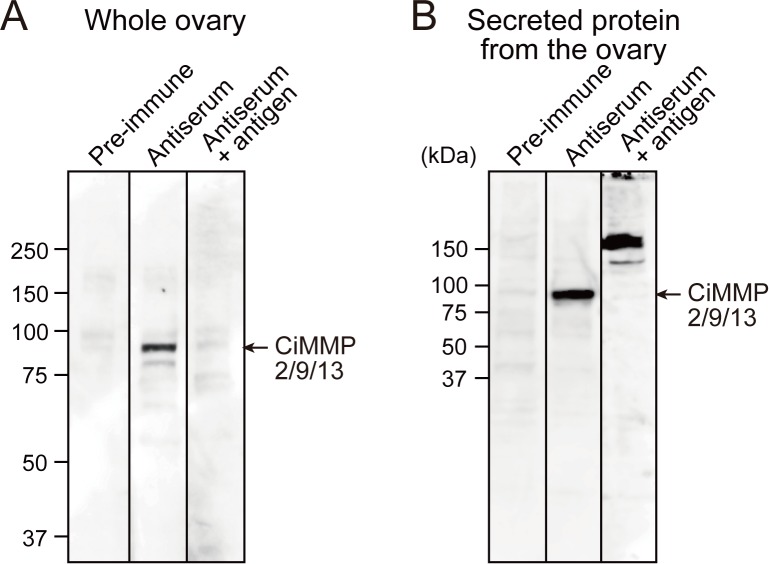
Figure 5—figure supplement 2. Specificity of the anti-CiMMP2/9/13 antibody.

Figure 5—figure supplement 2.

A total of 30 μg of soluble protein (A) and secreted protein (B) form Ciona ovaries was subjected to Western blotting. Bands specific to CiMMP2/9/13 were detected with anti-CiMMP2/9/13 antiserum but not pre-immune serum. The bands were abolished by pre-incubation of the antiserum with antigen, confirming the specificity of anti-CiMMP2/9/13 antibody.
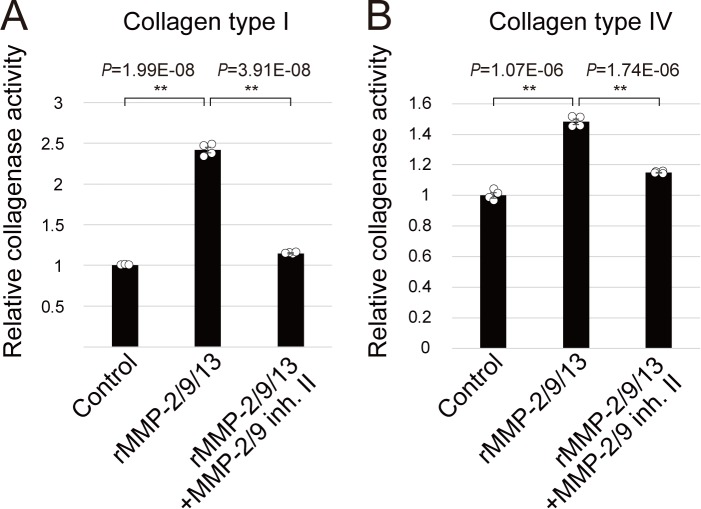
Figure 5—figure supplement 3. In vitro collagenase assay.

Figure 5—figure supplement 3.

A total of 0.5 μg of rMMP-2/913 was incubated with DQ collagen type I (A) or type IV (B) in in the presence or absence of 1 μM MMP-2/MMP-9 inhibitor II at 20°C. After the 48 hr incubation, the fluorescence was measured. Data are shown as mean ± SEM and analyzed by Student’s t test (n = 4). The significant collagenase activity of rMMP-2/9/13 was observed (t-value: −38.69; **, p=1.99E-08 in type I collagen and t-value: −19.82; **, p=1.07E-06 in type IV collagen), which was significantly inhibited in the presence of MMP-2/9 inhibitor II (t-value: 34.56; **, p=3.91E-08 in type I collagen and t-value: 18.25; **, p=1.74E-06 in type IV collagen), confirming an availability of the inhibitor.