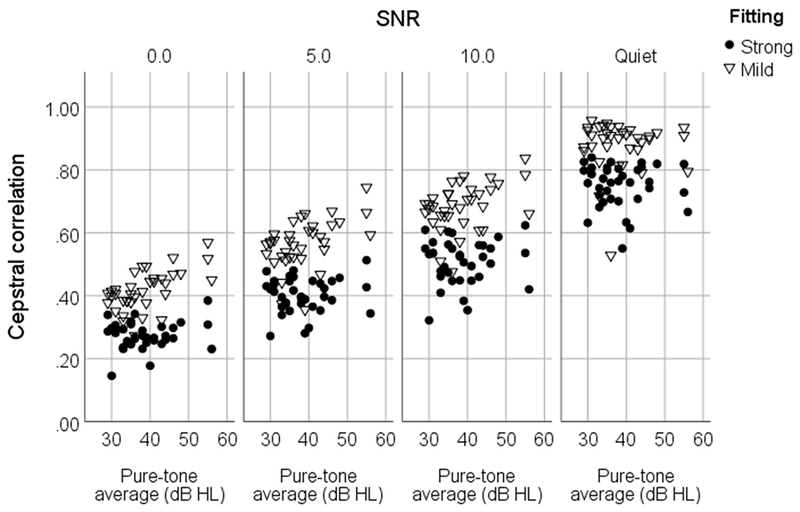
Figure 5.

Metric values (cepstral correlation) for the mild and strong signal processing conditions for each of the presented signal to noise ratios, shown as a function of the listener’s 4-frequency (.5, 1, 2, 3 kHz) pure-tone average. Although aided speech recognition in quiet was not measured, the metric for quiet speech is shown for information purposes. Each data point shows the metric difference for the right ear of an individual participant (left ear was similar).
