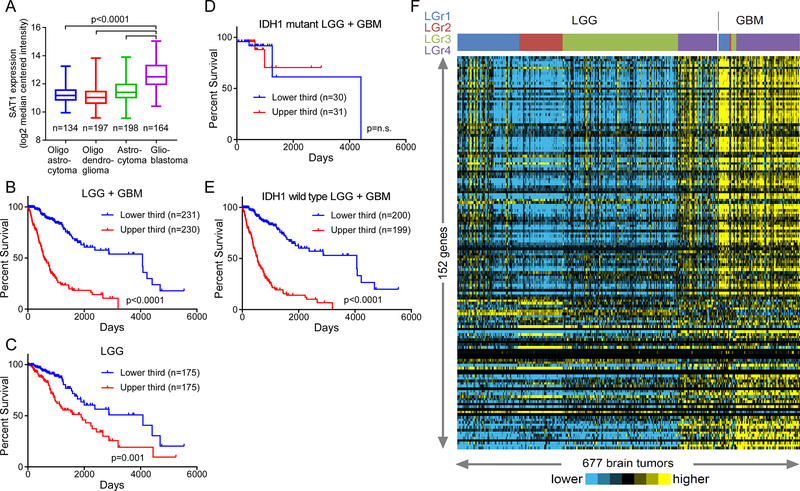
Figure 2: SAT1 target genes are elevated in aggressive brain tumors:
A) The expression of SAT1 in low and high grade gliomas from the TCGA LGG+GBM database. Pairwise statistical comparisons of low grade glioma to GBM are indicated (student’s t-tests). B) Kaplan-Maier survival plot for low and high grade gliomas dichotomized by SAT1 expression. C) Kaplan-Maier survival plot for only low grade gliomas dichotomized by SAT1 expression. D) Kaplan-Maier survival plot for low and high grade IDH1 mutant gliomas dichotomized by SAT1 expression. E) Kaplan-Maier survival plot for low and high grade IDH1 wild type gliomas dichotomized by SAT1 expression. F) Expression of SAT1 target genes in 677 brain tumors of both low and high grades, organized by LGr classifications.

