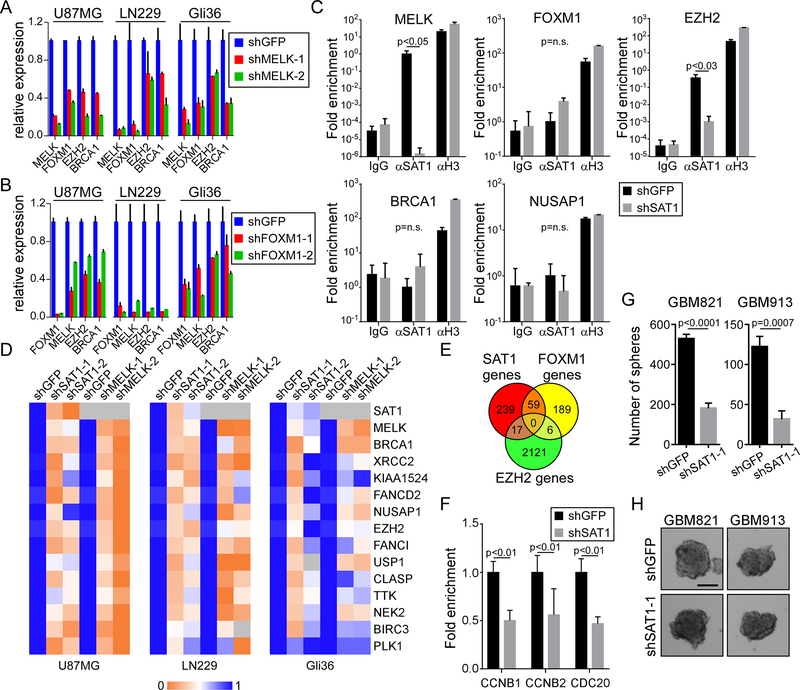
Figure 3: MELK and EZH2 are SAT1 direct target nodes:
A) Assessment of FOXM1, EZH2, and BRCA1 in control (shGFP) and MELK knockdown U87MG, LN229 and Gli36 cells by qRT-PCR. p<0.05 for all genes in the knockdown experiments. B) Assessment of MELK, EZH2, and BRCA1 in shGFP and shFOXM1 U87MG, LN229 and Gli36 cells by qRT-PCR. p<0.05 for all genes in the knockdown experiments. C) Input normalized SAT1 ChIP assay on U87MG shGFP and shSAT1 cells on the MELK, FOXM1, EZH2, BRCA1, and NUSAP1 promoters. Histone H3 ChIP is a positive control. D) Heat map of expression of SAT1 targets measured by RTPCR in shSAT1 U87MG, LN229 and Gli36 cells compared to shMELK cells. E) Venn diagram comparing SAT1 target genes with published FOXM1 and EZH2 targets. F) FOXM1 ChIP in shGFP and shSAT1 U87MG cells. G) Neurosphere formation assay in GBM821 and GBM913 lines with shGFP or shSAT1–1. H) Photomirographs of neurospheres. Scale bar 100 μm

