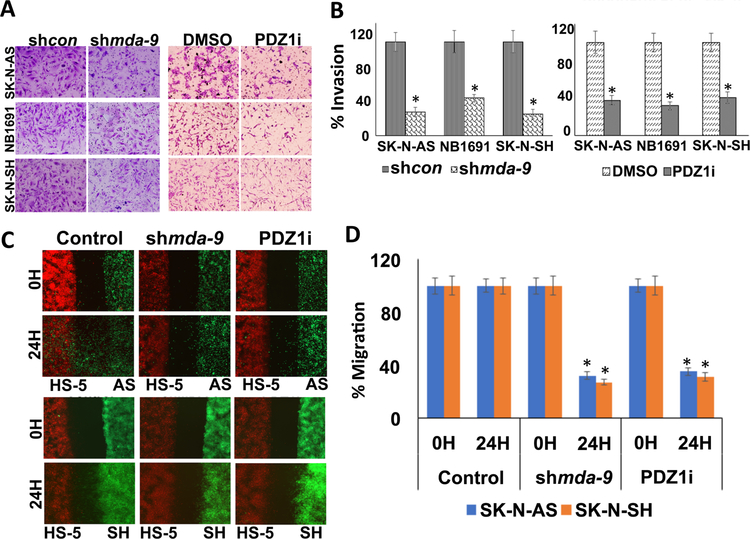
Figure 4: MDA-9 regulates NB cell migration and invasion.
(A) NB cells were treated as indicated for 48 hours. Cells were then seeded onto Matrigel coated trans-well inserts and allowed to invade, and then fixed, stained and photographed. (B) Percentages of invading cells were quantified by counting 5 fields for each experimental condition. (C) NB cells were seeded into one well (Green) and HS-5 cells (Red) were seeded into another well of a trans-well insert. Once the cells attached, the culture-inserts were removed and incubated for 24 hours. Images were captured at 0 h and 24 hours. (D) Cell migration was quantified and shown as a bar graph, Columns, mean of triplicate experiments. Bars, S.D.; *, P < 0.01 versus control.

