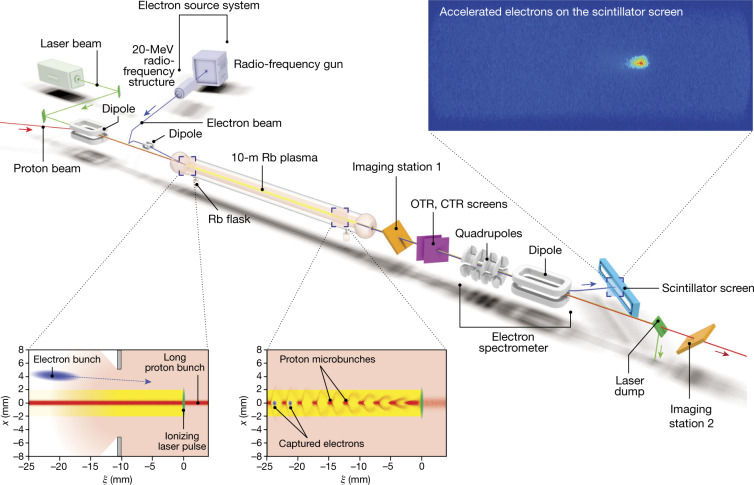
Fig. 1. Layout of the AWAKE experiment.
The proton bunch and laser pulse propagate from left to right across the image, through a 10-m column of rubidium (Rb) vapour. This laser pulse (green, bottom images) singly ionizes the rubidium to form a plasma (yellow), which then interacts with the proton bunch (red, bottom left image). This interaction modulates the long proton bunch into a series of microbunches (bottom right image), which drive a strong wakefield in the plasma. These microbunches are millimetre-scale in the longitudinal direction (ξ) and submillimetre-scale in the transverse (x) direction. The self-modulation of the proton bunch is measured in imaging stations 1 and 2 and the optical and coherent transition radiation (OTR, CTR) diagnostics. The rubidium (pink) is supplied by two flasks at each end of the vapour source. The density is controlled by changing the temperature in these flasks and a gradient may be introduced by changing their relative temperature. Electrons (blue), generated using a radio-frequency source, propagate a short distance behind the laser pulse and are injected into the wakefield by crossing at an angle. Some of these electrons are captured in the wakefield and accelerated to high energies. The accelerated electron bunches are focused and separated from the protons by the quadrupoles and dipole magnet of the spectrometer (grey, right). These electrons interact with a scintillating screen, creating a bright intensity spot (top right image), allowing them to be imaged and their energy inferred from their position.

