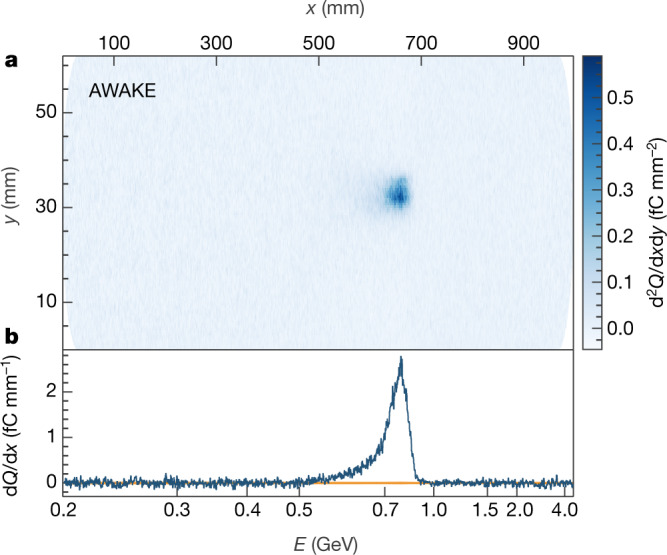
Fig. 2. Signal of accelerated electrons.

a, An image of the scintillator (with horizontal distance x and vertical distance y) with background subtraction and geometric corrections applied is shown, with an electron signal clearly visible. The intensity of the image is given in charge Q per unit area (d2Q/dxdy), calculated using the central value from the calibration of the scintillator. b, A projection of the image in a is obtained by integrating vertically over the charge observed in the central region of the image. A 1σ uncertainty band from the background subtraction is shown in orange around zero. Both the image (a) and the projection (b) are binned in space, as shown on the top axis, but the central value from the position–energy conversion is indicated at various points on the bottom axis. The electron signal is clearly visible above the noise, with a peak intensity at an energy of E ≈ 800 MeV.
