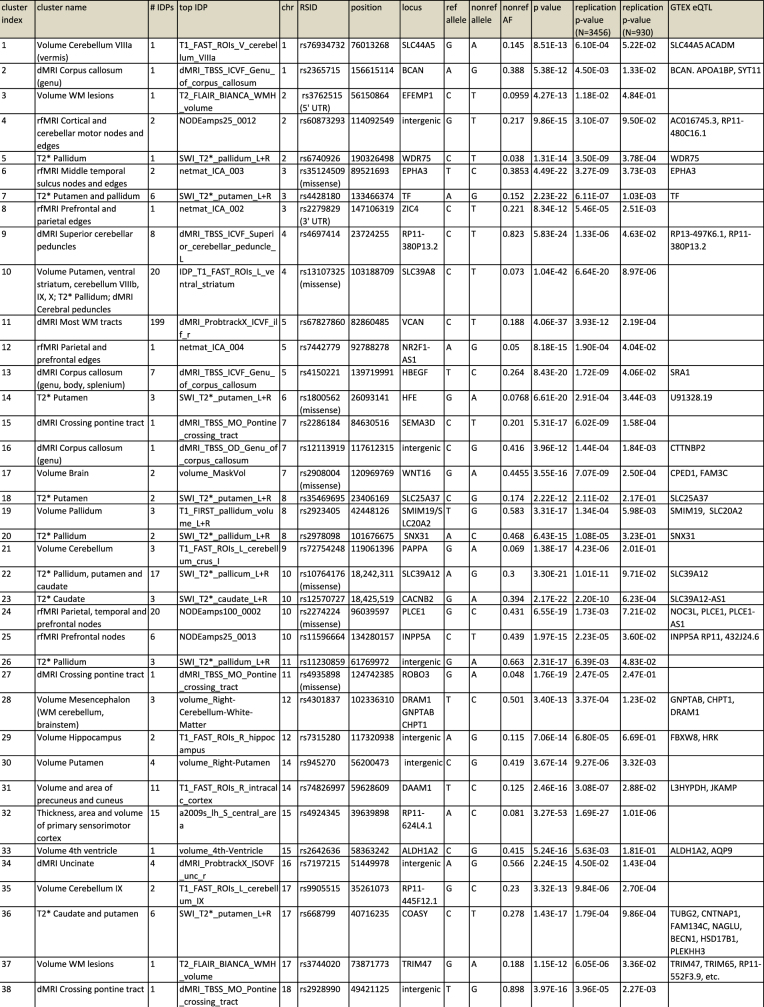
Extended Data Table 1.
Summary of most highly associated SNP–IDP clusters
The table summarizes the 38 clusters of SNP–IDP associations (n = 8,428 subjects, see main text and Methods for details). For each cluster, the most significant association between an SNP and an IDP is detailed by the chromosome, rsID, base-pair position, SNP alleles, non-reference allele frequency, P value in the discovery sample and the replication P values. The locus column details a gene if the SNP is in that gene. If we found a coding SNP or eQTL in high linkage disequilibrium with the lead SNP, then this is reported instead.

