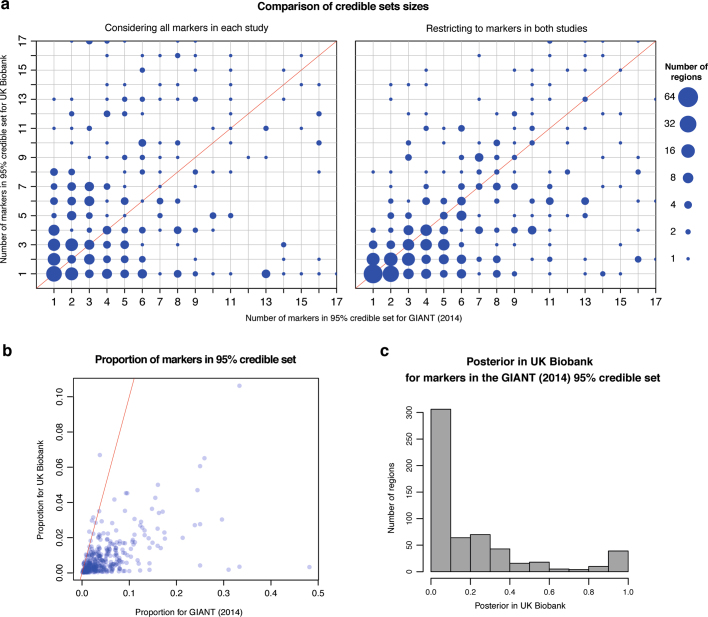
Extended Data Fig. 6. Comparison of fine-mapping in GIANT (2014) and UK Biobank imputed data.
Here we summarize results of our credible set analysis in GIANT (2014) and UK Biobank for 575 genomics regions associated with standing height in both studies (see Methods). A red solid line on a plot indicates where x = y. a, Both plots compare the number of markers in the 95% credible sets in which the size is less than 18 markers in both studies (363 regions in the left-hand plot; 445 in the right-hand plot). b, c, Both plots are from the analysis considering all markers in each study. In b we show, for each region, the proportion of markers used in the analysis for a given study that are in the 95% credible set for that study. The plot contains the same 363 regions as shown in the left-hand plot in a. In c we summarize, for all 575 regions, how much weight our UK Biobank analysis placed on markers that our analysis of GIANT (2014) indicated were important.

