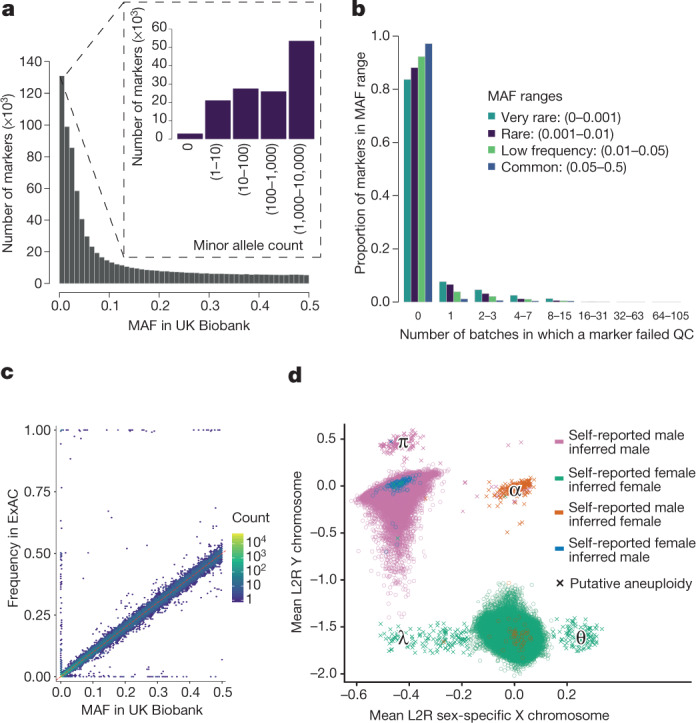
Fig. 2. Summary of genotype data quality and content.

All plots show properties of the UK Biobank genotype data after applying quality control. a, MAF distribution based on all samples (805,426 markers). The inset shows rare markers only (MAF < 0.01). b, The distribution of the number of batch-level quality control (QC) tests that a marker fails (see Methods). For each of four MAF ranges, we show the fraction of markers that fail the specified number of batches. c, Comparison of MAF in UK Biobank with the frequency of the same allele in ExAC, among the European-ancestry participants within each study (Supplementary Information). This analysis used 91,298 overlapping markers. Each hexagonal bin is coloured according to the number of markers falling in that bin (log10 scale). The dashed red line shows x = y. The markers with very different allele frequencies seen on the top, bottom and left-hand sides of the plot comprise approximately 300 markers. This is 0.3% of all markers in the comparison (see Supplementary Information for discussion). d, Mean log2 ratios (L2R) on X and Y chromosomes for each sample, indicating probable sex chromosome aneuploidy (see Methods). There are 652 samples with a probable sex chromosome aneuploidy (indicated by crosses). Locations of clusters of individuals with different putative karyotypes are indicated by Greek symbols: λ = X0 (or mosaic XX/X0), θ = XXX, α = XXY, and π = XYY. Counts of individuals in these regions are given in Supplementary Table 2. The colours indicate different combinations of self-reported sex, and sex inferred by Affymetrix (from the genetic data). For almost all samples (99.9%), the self-reported and the inferred sex are the same, but for a small number of samples (378) they do not match (see Supplementary Information for discussion).
