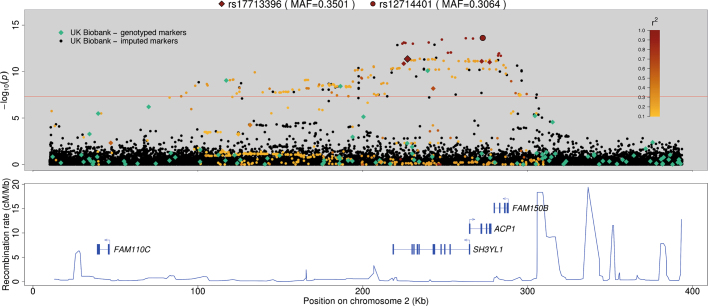
Extended Data Fig. 5. Example region of association in standing height GWAS.
GWAS association statistics (P values) for standing height focusing on a ~3-Mb region of chromosome 2 that did not reach genome-wide significance in the GIANT (2014) meta-analysis, but did in UK Biobank (linear mixed model; see Methods). The P values shown are not adjusted for multiple testing. Markers genotyped in the UK Biobank are shown as diamonds, and imputed markers as circles. The two markers with the smallest P value for each of the genotyped data and imputed data are enlarged and highlighted with black outlines, and other UK Biobank markers are coloured according to their correlation (r2) with one of these two. That is, genotyped markers with the leading genotyped marker (rs17713396), and imputed markers with the leading imputed marker (rs12714401). Markers with r2 values of less than 0.1 are shown as black or green.

