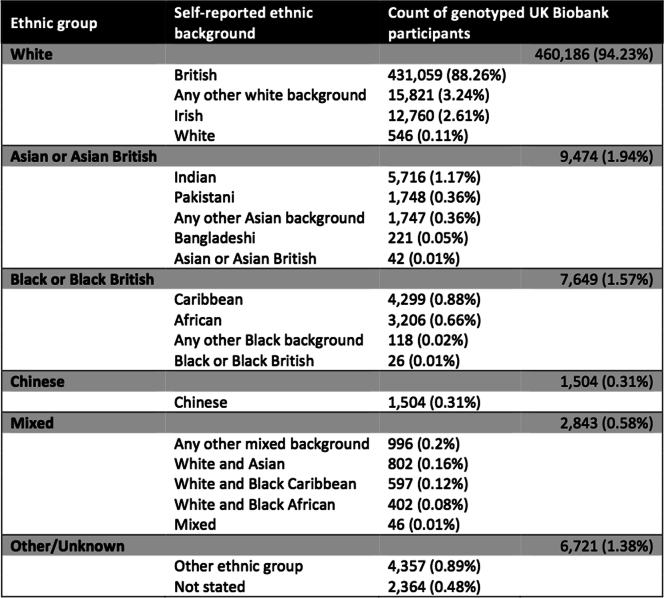
Extended Data Table 3.
Counts and proportions of self-reported ethnic groups among 488,377 genotyped UK Biobank participants
Categories of self-reported ethnic background (UK Biobank data field 21000) and broader-level ethnic groups are shown here to reflect the two-layer branching structure of the ethnic background section in the UK Biobank touchscreen questionnaire14. Participants first picked one of the broader-level ethnic groups (for example, ‘white’), and were then prompted to select one of the categories within that group (for example, ‘Irish’). The broader-level groups are also shown here as an ethnic background category (‘white’ in column two) because a small proportion of participants only responded to the first question. In this table, we also combine the category ‘other ethnic group’ with an aggregated non-response category ‘not stated’, which includes all participants who did not know their ethnic group, or stated that they preferred not to answer, or did not answer the first question.

