Figure 3.

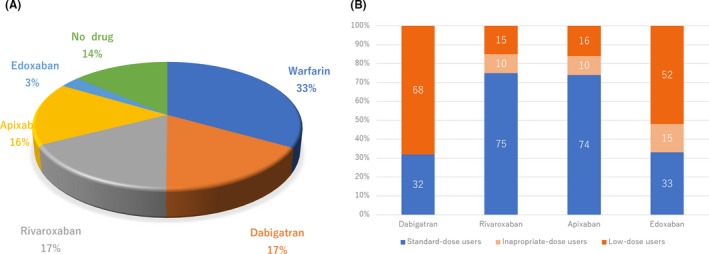
The proportion of anticoagulants and dosing. Panel A shows the proportion of anticoagulants and panel B the proportion of standard or low dosing of each DOAC. The numbers indicated the percentages

The proportion of anticoagulants and dosing. Panel A shows the proportion of anticoagulants and panel B the proportion of standard or low dosing of each DOAC. The numbers indicated the percentages