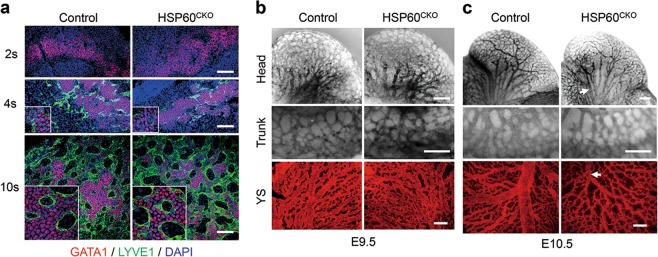
Fig. 2. Endothelial cell specification and vascular development in control and HSP60CKO mice.
a Immunofluorescence staining of GATA1 and LYVE1 in yolk sacs isolated at the 2-somite (2 s), 4-somite (4 s), and 10-somite (10 s) ages, respectively. Data are representative of at least three independent experiments. Scale bar, 100 μm. b and c Vasculature in control and HSP60CKO embryonic heads (top), trunks (middle), and yolk sacs (bottom) identified by PECAM1 staining at E9.5 (b) and E10.5 (c). Blood vessels with reduced diameters (white arrows) were easily observed in HSP60CKO samples at E10.5. Data are representative of at least three independent experiments. Scale bar, 200 μm

