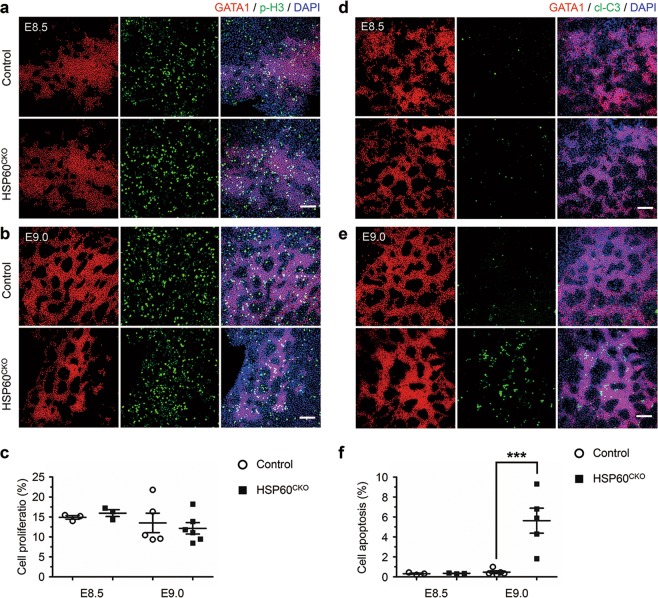
Fig. 3. Deletion of Hsp60 increased cell apoptosis in erythrocytes.
a, b Immunofluorescence staining of GATA1 and phosphorylated Histone 3 (p-H3) in control and HSP60CKO yolk sacs at E8.5 (a) and E9.0 (b), respectively. Scale bar, 100 μm. c Statistical analysis showing that the numbers of p-H3 and GATA1 double positive cells are not significantly altered in HSP60CKO yolks (n = 3, E8.5; n = 6, E9.0) at both ages compared with control yolk sacs (n = 3, E8.5; n = 5, E9.0). All data represent mean ± SEM. Significance was determined using a 2-tailed, unpaired Student’s t test. d and e Immunofluorescence staining of GATA1 and cleaved Caspase3 (cl-C3) in control and HSP60CKO yolk sacs at E8.5 (d) and E9.0 (e), respectively. Scale bar, 100 μm. f Statistical analysis showing that the numbers of cl-C3 and GATA1 double positive cells are significantly reduced in HSP60CKO yolk sacs (n = 3, E8.5; n = 5, E9.0) at E9.0 compared with control yolk sacs (n = 3, E8.5; n = 5, E9.0). All data represent mean ± SEM. Significance was determined using a 2-tailed, unpaired Student’s t test. ***p < 0.001 versus control

