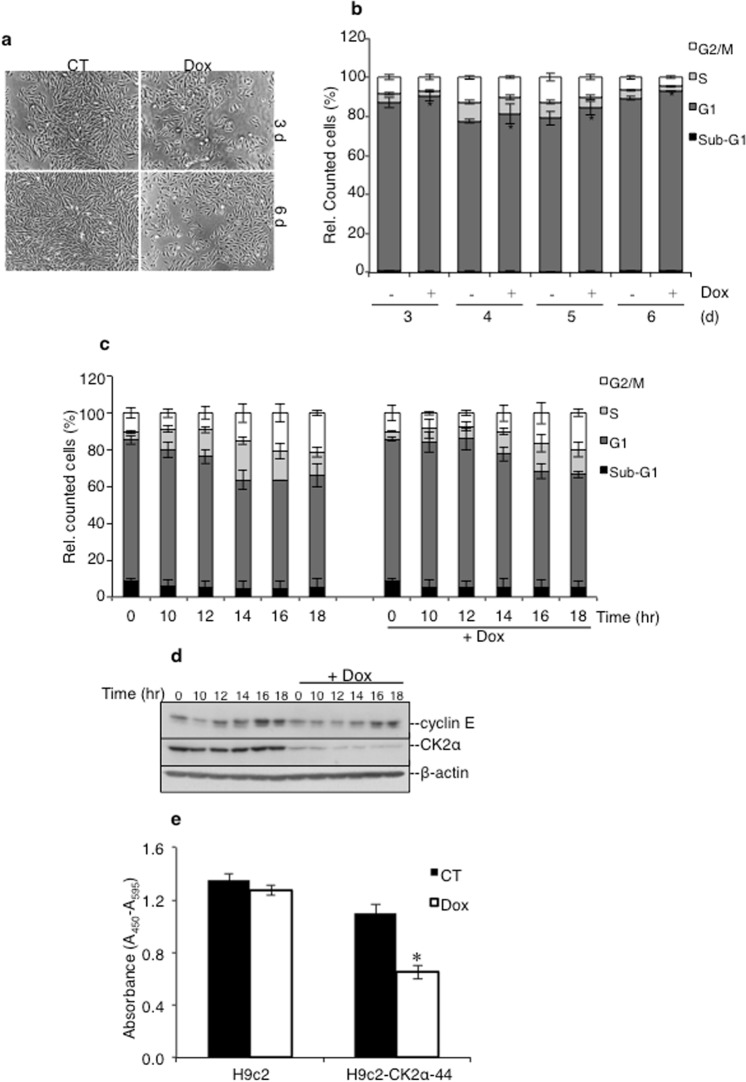
Figure 2.
Down-regulation of CK2α perturbs G1/S cell cycle transition dynamics. (a) H9c2-CK2α-44 cells were treated with vehicle (CT) or doxycycline for three days and six days, respectively. Phase contrast images were taken at 50x magnification. (b) Cells were incubated with vehicle or 1 μg/ml doxycycline for up to six days as indicated in the figure. Cell cycle analysis was performed following propidium iodide staining. Amount of cells in the various phases of the cell cycle are expressed in percentage. *P < 0.05 with respect to control experiment. Figure shows the results of three independent experiments. (c) Cells were synchronized by serum starvation for 48 h in the absence or presence of doxycycline and harvested at the indicated time points after release from starvation. Cell synchronization was confirmed by flow cytometry analysis. The experiment was repeated three times obtaining similar results. (d) Western blot analysis of whole lysate from cells treated as indicated in (c) was carried out employing the indicated antibodies. Experiments were repeated three times obtaining similar results. One representative experiment is shown. (e) H9c-2 and H9c2-CK2α-44 cells left untreated or incubated with 1 µg/ml doxycycline for three days were labeled with BrdU during the last eight hours of incubation time. Detection of fixed cells was carried out employing an anti-BrdU antibody coupled to horseradish peroxidase. Colorimetric reactions were quantified by measuring the absorbance at 450 nm. Values are shown in arbitrary units as average of six replicates +/− STDEV, *P < 0.00001 with respect to control (i.e. cells treated with vehicle). Experiments were repeated twice obtaining similar results.

