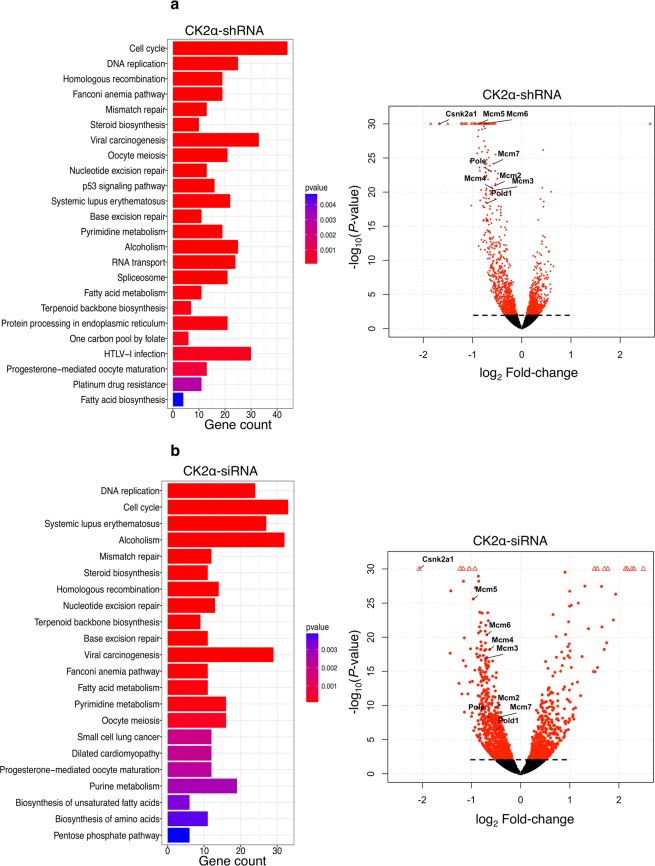
Figure 5.
Genome-wide expression analysis reveals unique signatures in cells with reduced expression of CK2α. (a) KEGG pathway analysis of H9c2-CK2α-44 cells left untreated or incubated with 1 µg/ml doxycycline for three days (upper bar-plot) and (b) of the parental cell line (i.e. H9c-2 cell line) transfected with scramble siRNA (scr-siRNA) or siRNA directed against CK2α (CK2α-siRNA, lower bar-plot) for three days following global transcription analysis by RNA-Seq. Bar-plots show enriched pathways with respect to the number of significantly down-regulated genes within each pathway relative to controls. Panels to the right display volcano plots showing log10 of P-values against log2 Fold-change of gene expression. Dots above dashed line refer to genes with an adjusted P-value (padj) ≤0.1.

