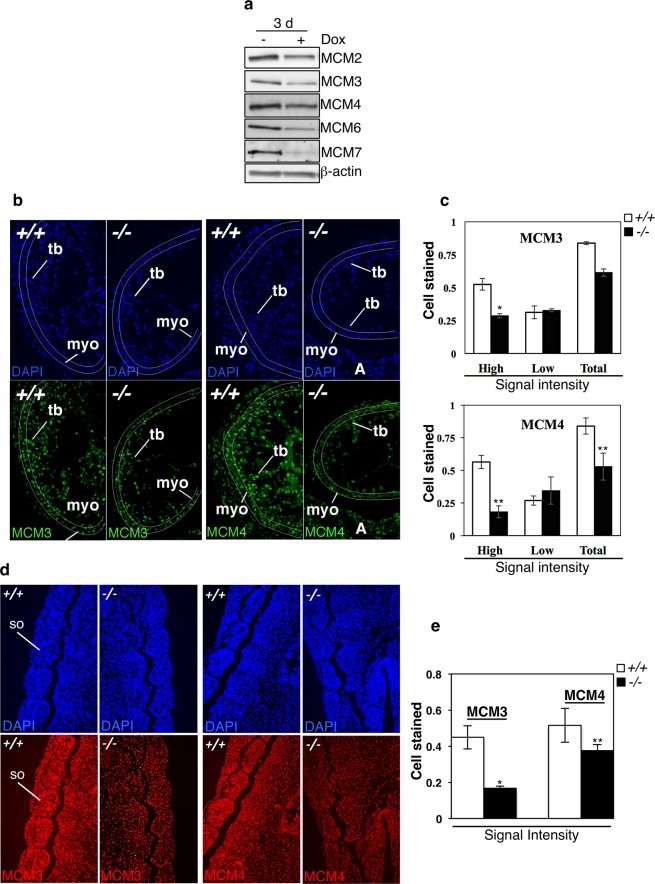
Figure 7.
Down-regulation of gene transcripts correlates with lowered expression of the corresponding MCM proteins in CK2α-depleted cells and CK2α−/− mouse embryo hearts and somites. (a) H9c2-CK2α-44 cells were treated with 1 µg/ml doxycycline for three days and whole cell lysates were employed for the detection of MCM proteins by Western blot as indicated in the figure. β-actin detection was used as loading control. (b) MCM3 and MCM4 immunofluorescence staining in heart sections of WT (+/+) and CK2α−/− (−/−) embryos at E10.5 (34 somite pairs). Photographs were taken at 20x magnification. Fluorescent images were pseudo-colored and show MCM proteins staining (nuclear, green). Lines mark approximately the area where cells were counted (non-trabecular myocardium). (c) Bar-graph showing in percentage the ratio of MCM positive cells/total number of cells in the myocardium, and the percentage of cells showing high and low stain intensity in the myocardium, respectively. Two to three sections each from two pairs of E10.5 WT and CK2α−/− embryos were analyzed. Represented values are mean +/− STDEV. Asterisks denote statistical significance: *P ≤ 0.05, **P ≤ 0.005. Abbreviations: A (atria); myo (non-trabecular myocardium); tb (trabecular myocardium). (d) Immunohistochemistry analysis of whole mouse embryo somites (E10.5) showing detection of MCM3 and MCM4 (nuclear, red signal), respectively. Photos were taken at 20x magnification and pseudo-colored. (e) Bar-graph showing in percentage the number of MCM positive cells/total number of cells in the embryos. Three to five sections each from three pairs of E10.5 WT and CK2α−/− embryos were analyzed. Represented values are mean +/− STDEV, *P ≤ 0.0005, **P ≤ 0.05. Abbreviations: so, somite.

