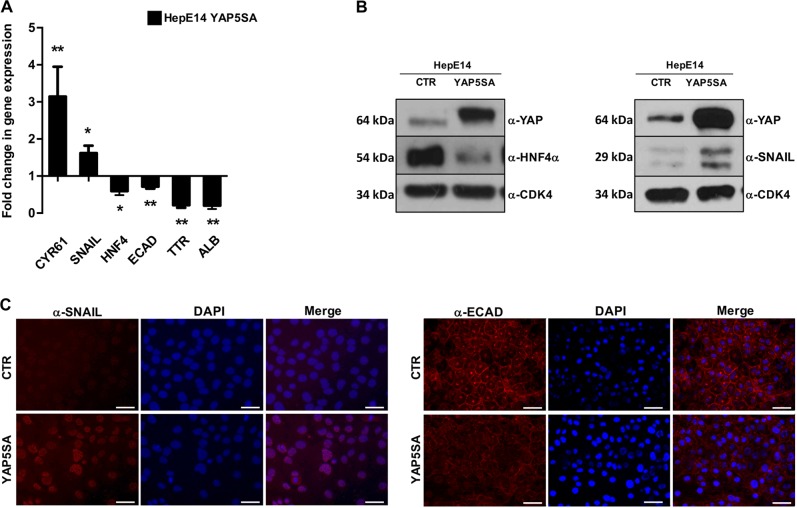
Fig. 2. YAP overexpression hampered HepE14 differentiation state.
a RT-qPCR analysis for the indicated markers in HepE14 transiently transfected with pQCXIH-Myc-YAP-5SA (HepE14 YAP5SA), compared with control cells transfected with empty vector (HepE14 CTR). The values are calculated by the 2(−ΔCt) method, expressed as fold of expression versus the control (arbitrary value = 1) and shown as means ± S.E.M. of at least three independent experiments. Statistically significant differences are reported (*p < 0.05; **p < 0.01). b Western blotting analysis for YAP, HNF4α and Snail in HepE14 YAP5SA and HepE14 CTR. CDK4 was used as a loading control. c Immunofluorescence analysis of Snail and E-cadherin in HepE14 YAP5SA, is compared with HepE14 CTR. Nuclei were stained with DAPI (blue). Images are representative of three independent experiments. Scale bar: 50 µm

