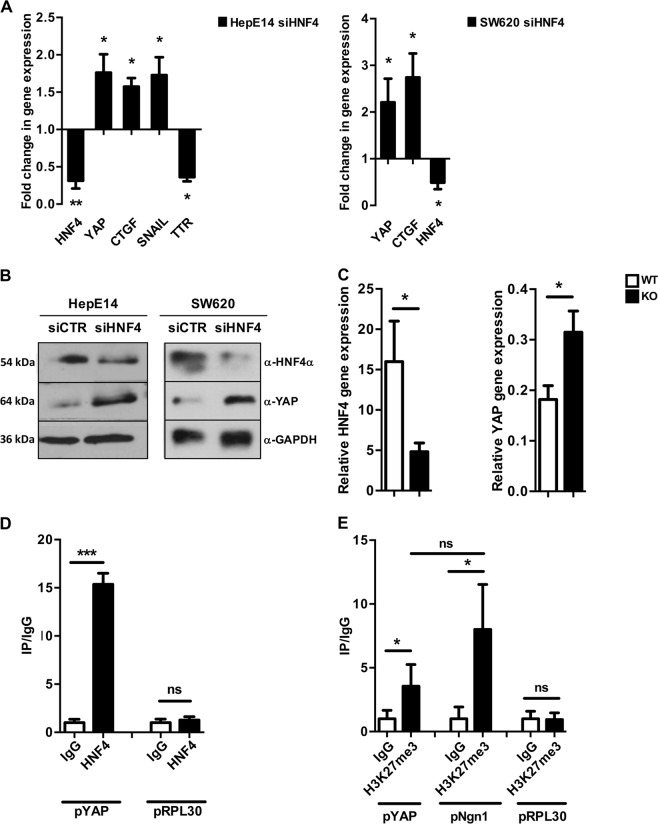
Fig. 5. HNF4α negatively controls YAP expression and activity.
a RT-qPCR analysis for the indicated genes in HNF4α-silenced HepE14 (HepE14 siHNF4) and colon SW620 cells (SW620 siHNF4), compared with GFP-silenced control cells. The values are calculated by the 2(−ΔCt) method, expressed as fold of expression versus the control (arbitrary value = 1) and shown as means ± S.E.M. of at least three independent experiments. Statistically significant differences are reported (*p < 0.05; **p < 0.01). b Western blotting analysis for YAP and HNF4α in HNF4α-silenced HepE14 and SW620 cells (siHNF4), compared with GFP-silenced control cells (siCTR). GAPDH was used as a loading control. c RT-qPCR analysis of YAP and HNF4α in liver samples from four hepatocyte-specific HNF4α knockout (KO) mice48 and four wild-type (WT) mice. Statistically significant differences between the two groups of mice are reported (*p < 0.05). d qPCR analysis of ChIP assays with α-HNF4α antibody (HNF4), and as control, with normal rabbit IgG on chromatin from HepE14 cells. Values derived from at least four independent experiments are calculated as IP/IgG and reported as means ± S.E.M. respect to the IgG sample (arbitrary value = 1). RPL30 promoter was used as negative control (***p < 0.001; ns = not significant). e qPCR analysis of ChIP assays with α-H3K27me3 antibody (H3K27me3), and as control, with normal rabbit IgG on the chromatin from HepE14 cells. Values derived from at least three independent experiments are calculated as IP/IgG and reported as means ± S.E.M. respect to the IgG sample (arbitrary value = 1). RPL30 and Neurogenin promoters were used as negative and positive control, respectively (*p < 0.05; ns = not significant)

