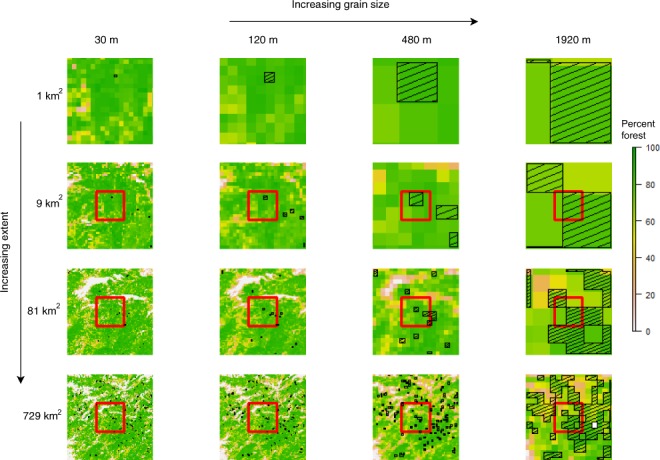
Figure 1.

Visual representation of increasing spatial scale along two main axes – total extent and grain size. Percent forest is characterized at 4 extents and 4 grain sizes in an area around the middle of the giant panda range, with giant panda presence cells depicted with a hatch pattern. The red squares in rows 2 to 4 indicate the previous total extent shown in the previous row. Note: these are not the total extents examined in this study, they are purely a visual demonstration of the effects of changing spatial scale on environmental and presence data.
